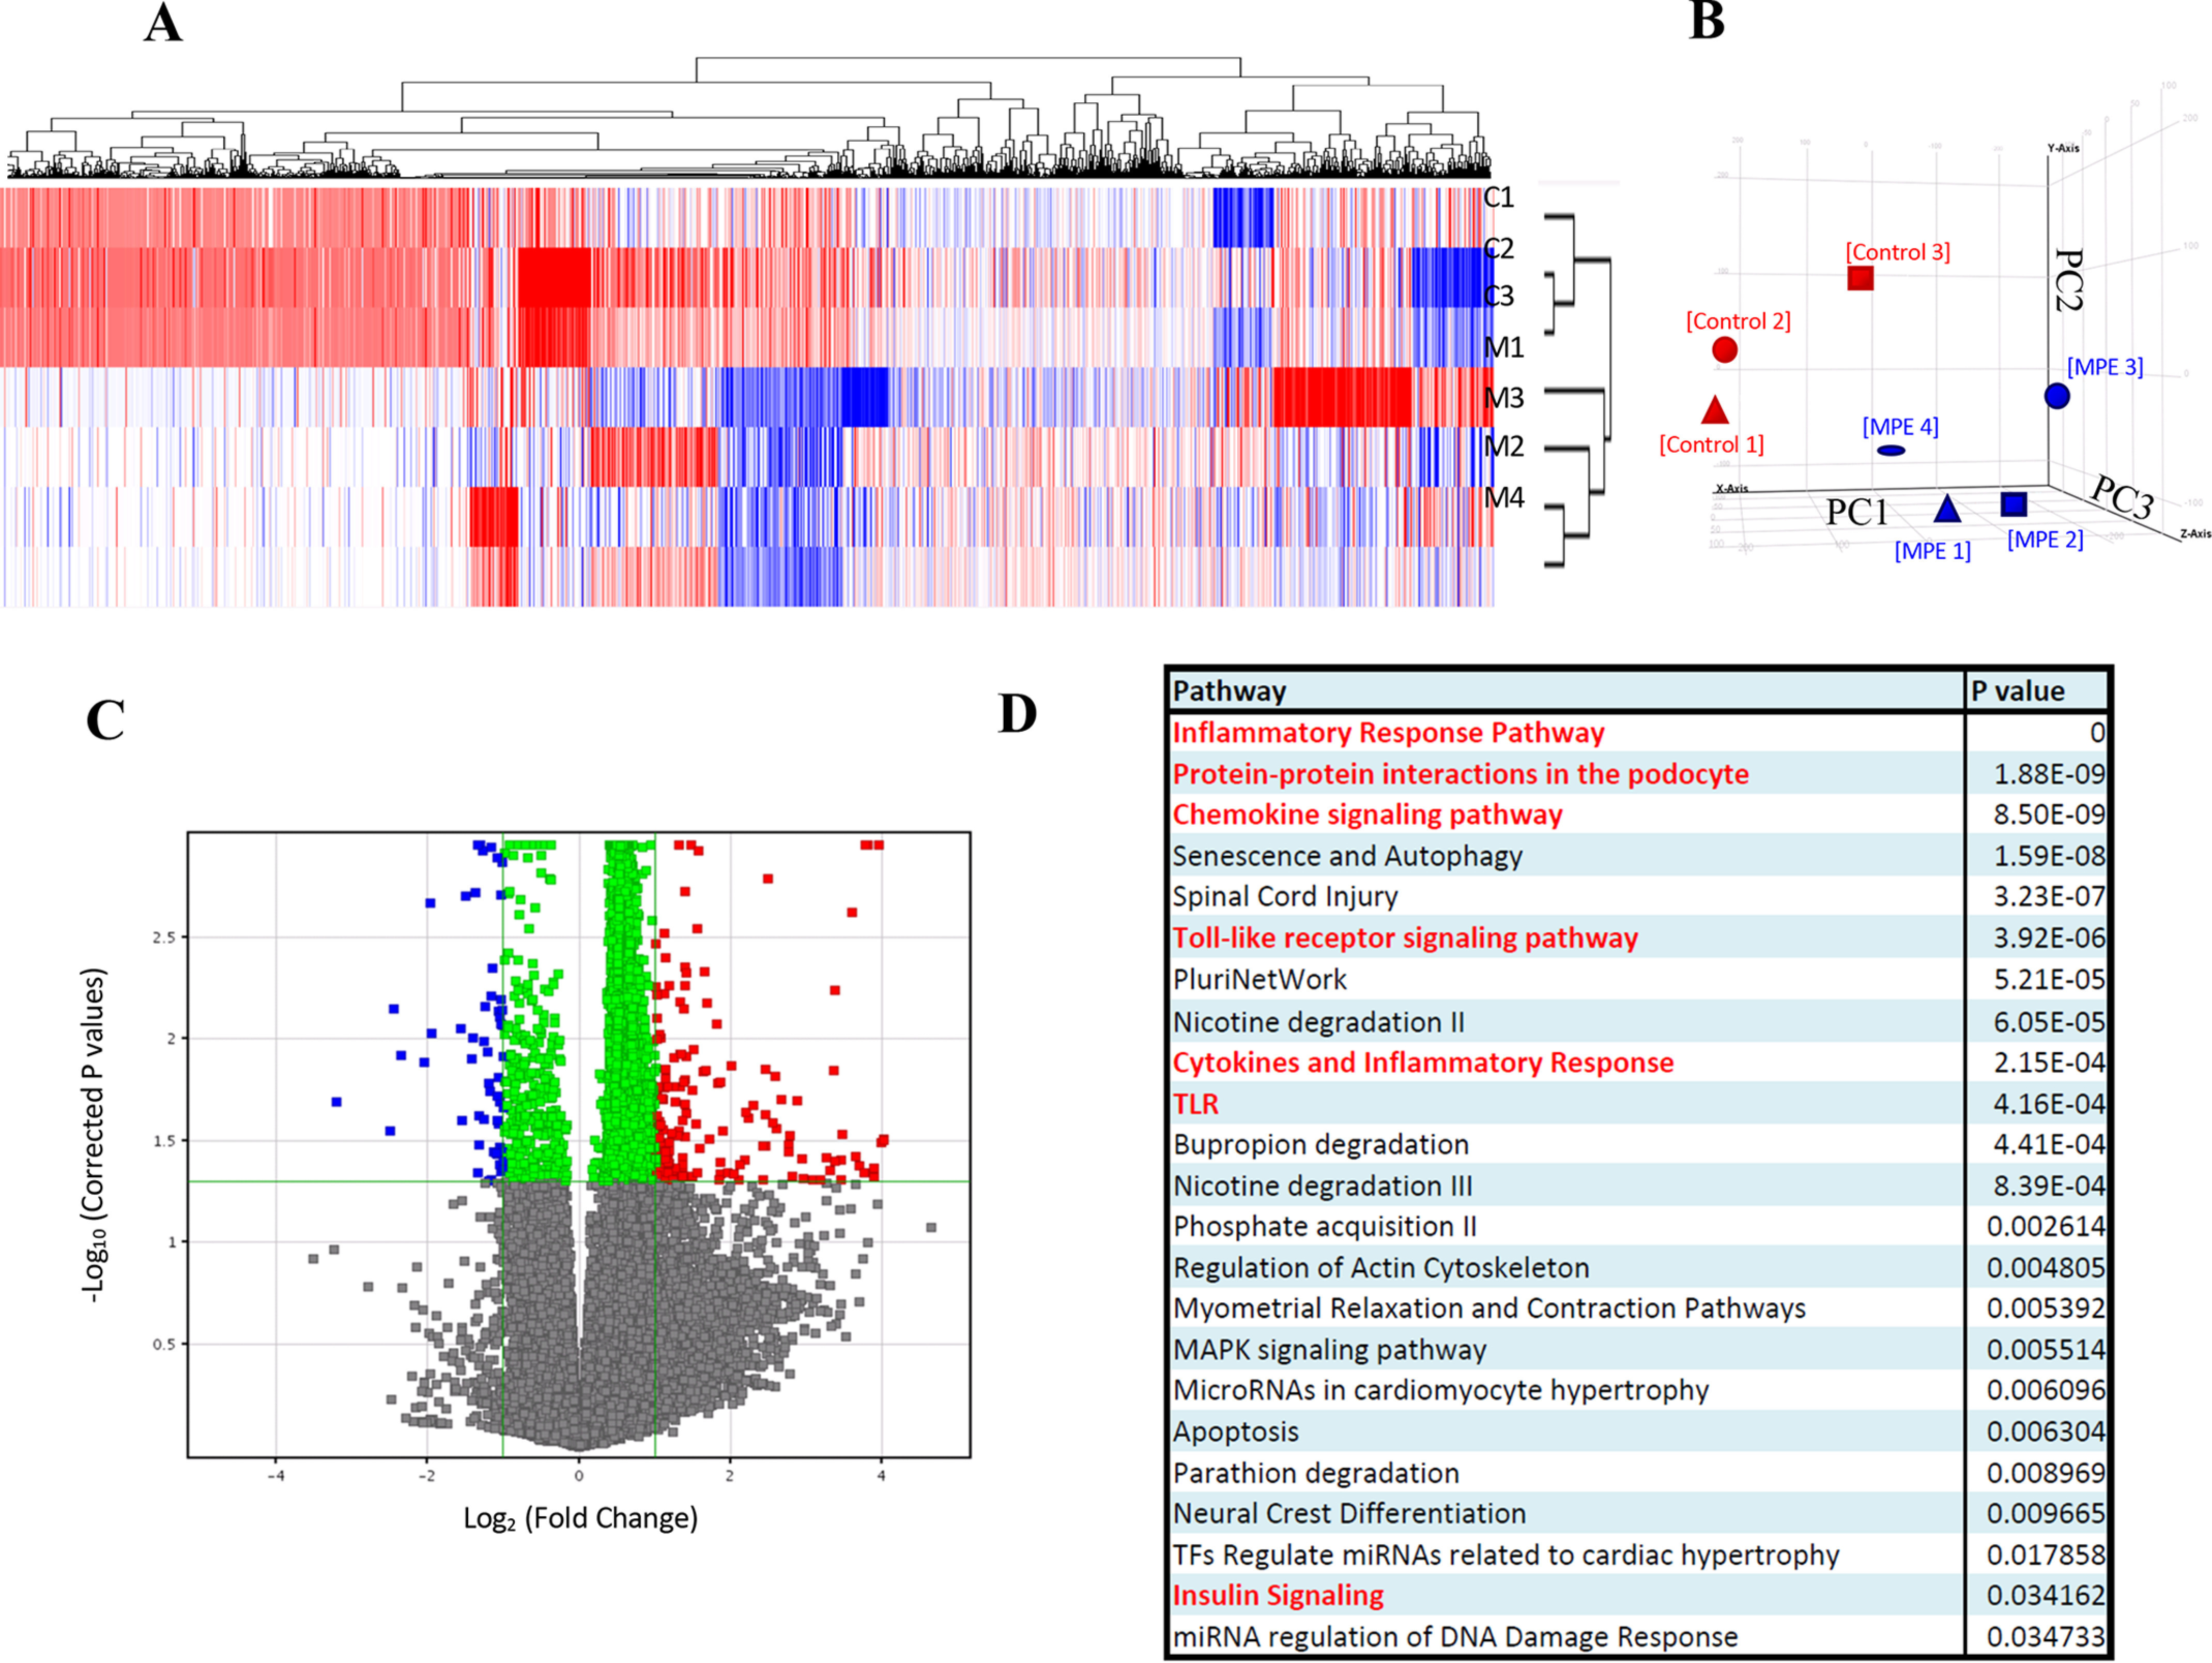
Figure 4.

Gene expression microarray and pathway analysis shows significant inhibition of IL-1β–IKK–NF-κB pathway by MPE treatment. A, k-means clustering; B, principal component analysis. Gene expression profiles of MPE-treated MIN6 cells are grouped together. The x axis shows principal component 1 (PC1), the y axis shows PC2, and the z axis shows PC3. C, volcano plot. Differential up-regulated and down-regulated genes are identified. D, gene ontology analysis. Chemokine, cytokine, inflammatory, TLR, and insulin pathways are major pathways in the differentially expressed genes. E, heat map. Differential down-regulated genes cluster in MPE-treated MIN6 cells are shown. Relative gene expression levels and -fold changes of pik3cd, tlr6 (Toll-like receptor 6), nfkb1, cd40, pik3ca, and il1b are shown. Red, up-regulations in control samples; blue, down-regulations in MPE-treated samples. F, MPE treatment attenuated the inflammatory IL-1β–IKK–NF-κB pathway. Red labels indicate the significant down-regulated genes in the pathway. G–J, validation of expression of pik3ca, pik3cd, nfkb1, and csf2 by RT-PCR. Error bars, S.E.
