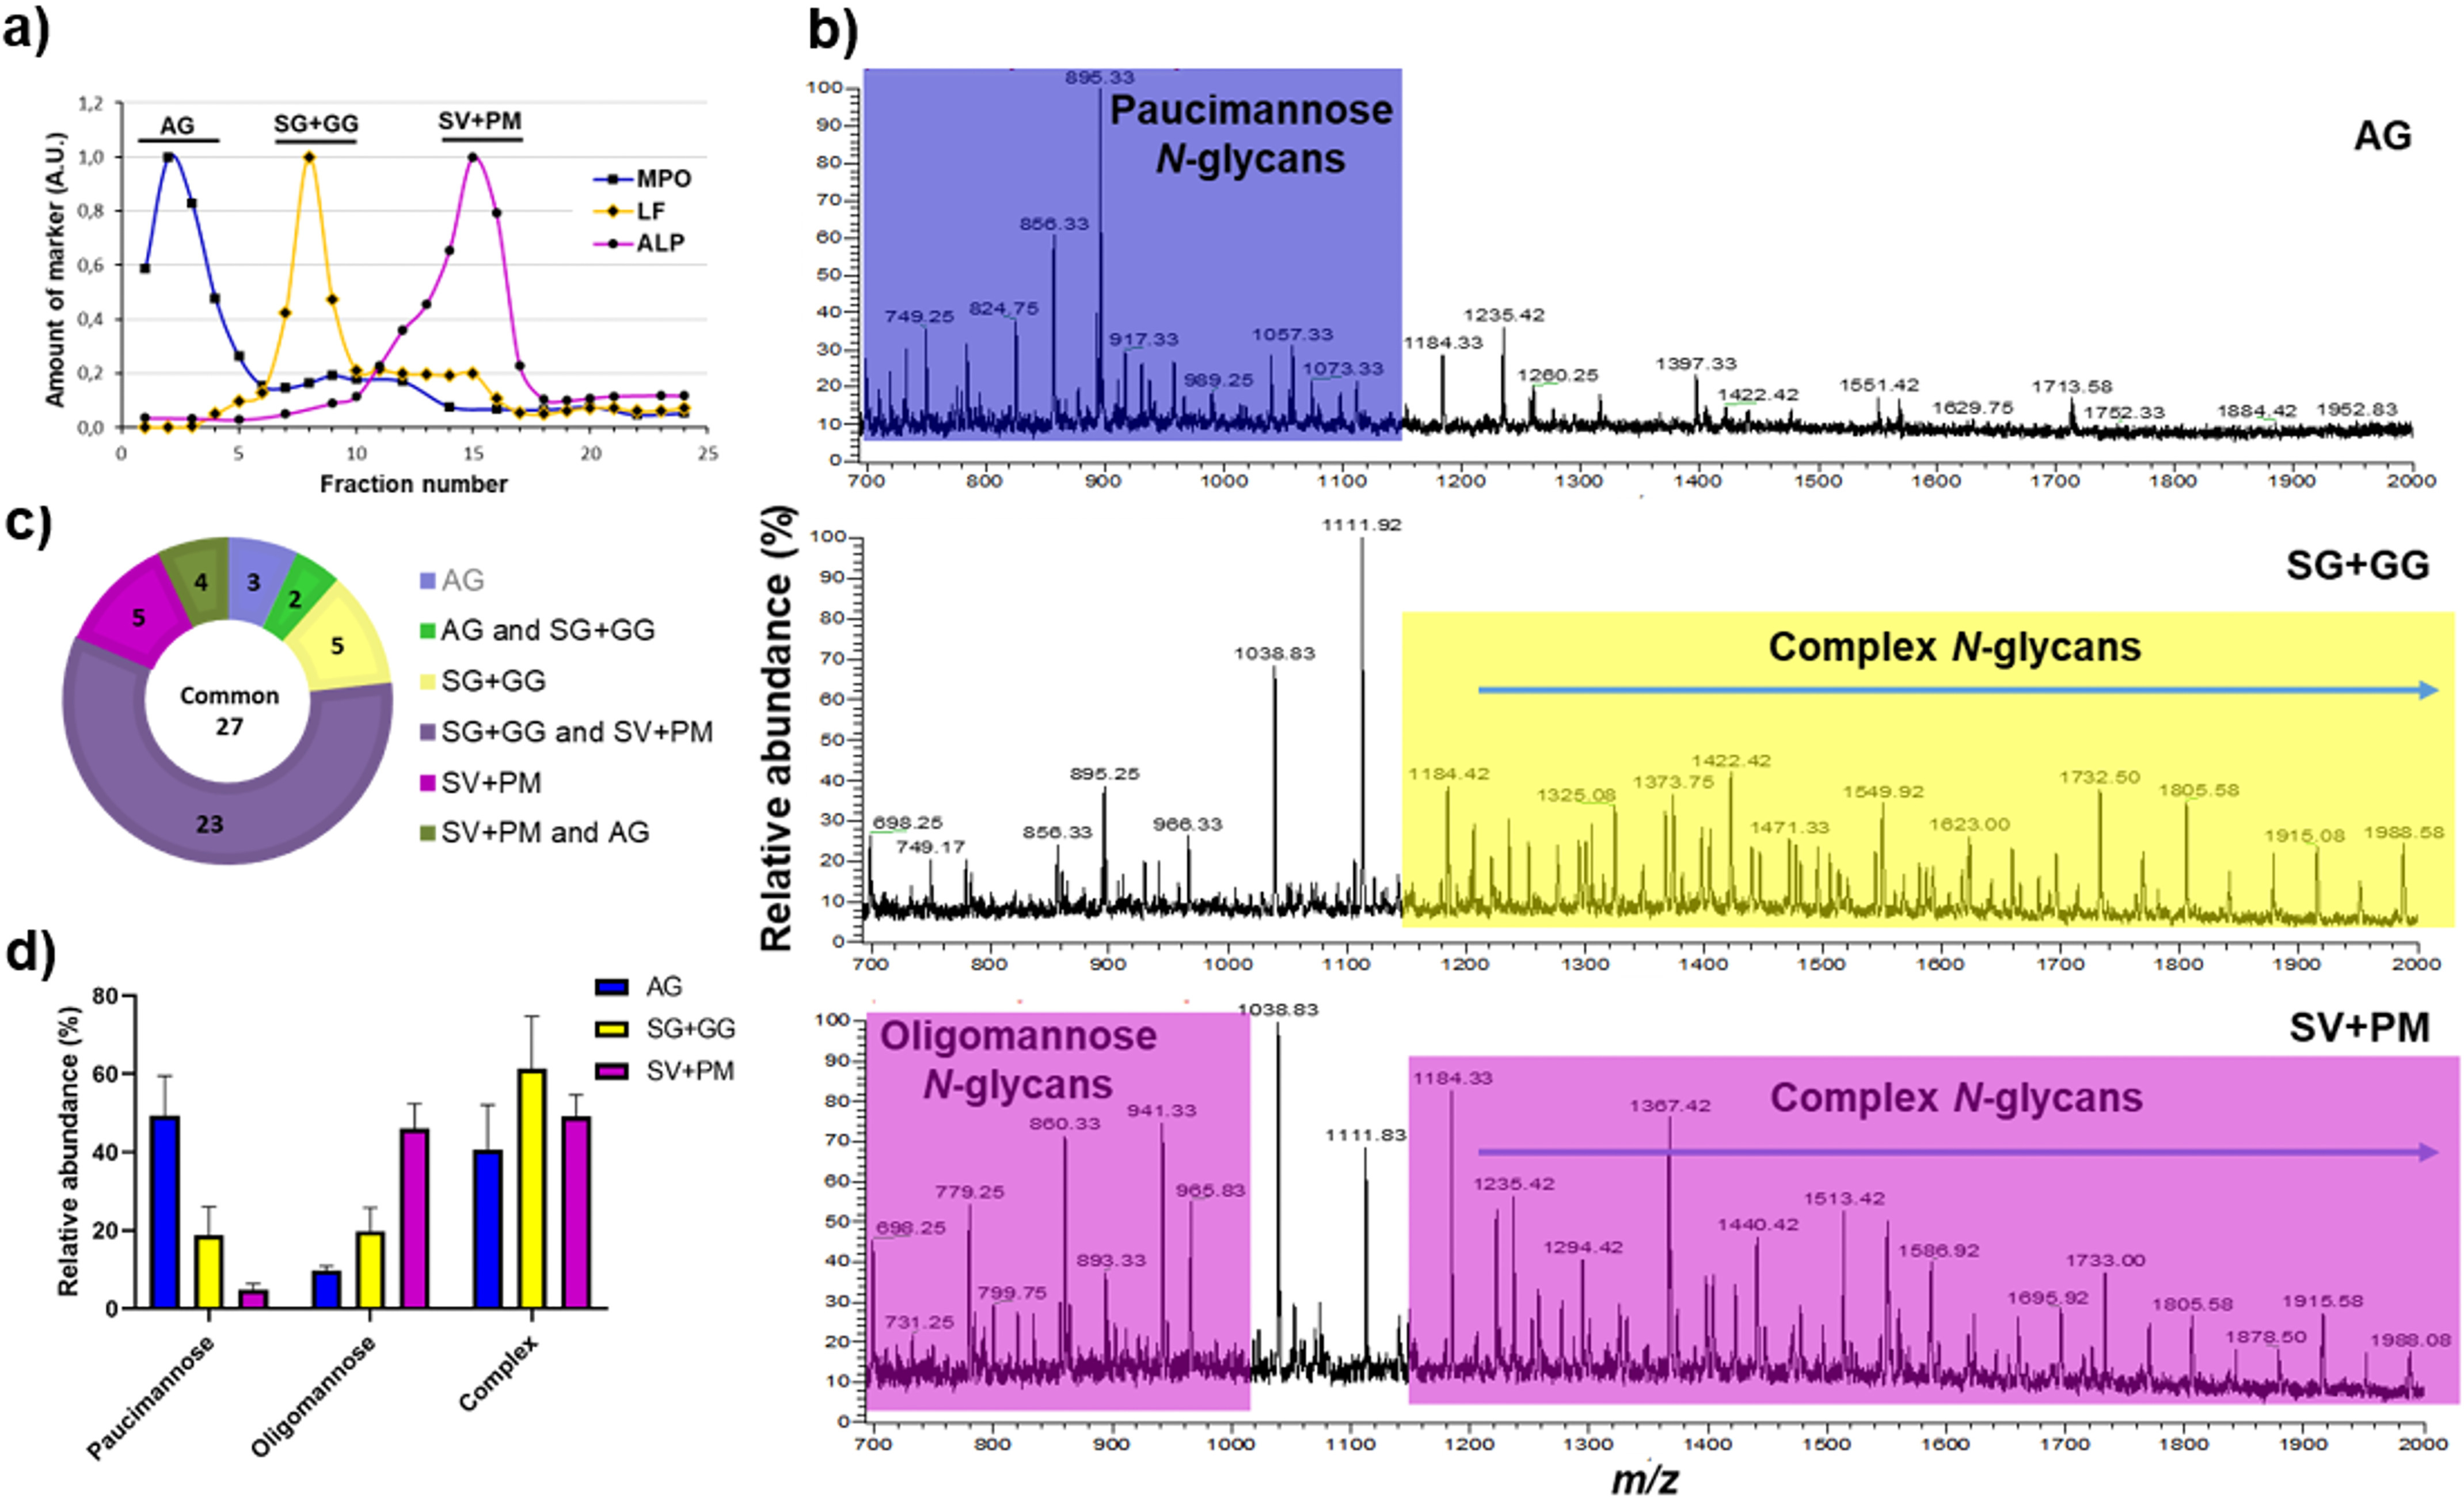
Figure 1.

Validation of neutrophil subcellular fractionation and organelle-specific neutrophil N-glycan profiling. a, the granules of naive (resting) neutrophils were fractionated using a two-layer Percoll gradient. Fractions were assigned to distinct neutrophil organelles based on the level of known granule-specific protein markers as determined using immunoblot and activity assays (y axis, arbitrary units, A.U.): MPO activity (marker for AG, filled squares); LF (marker for SG, filled diamonds); and total ALP activity (measured in the presence of detergent; marker for SV + PM, filled circles). The data shown are representative from three separate, independent experiments. b, mass spectral profiles of N-glycans released from neutrophil granule protein extracts showing dramatic qualitative N-glycan profile differences between the AG, SG + GG, and SV + PM fractions. Characteristic N-glycan types for each granule fraction have been color-coded to highlight the most prominent differences. c, distribution of the identified N-glycan structures in the different neutrophil subcellular compartments. d, the N-glycans identified in the different subcellular fractions were grouped into the major N-glycan types, i.e. paucimannosidic, oligomannosidic, and complex N-glycans and their relative abundance were determined for each granule subset. The data points are plotted as the mean ± S.E. (n = 3).
