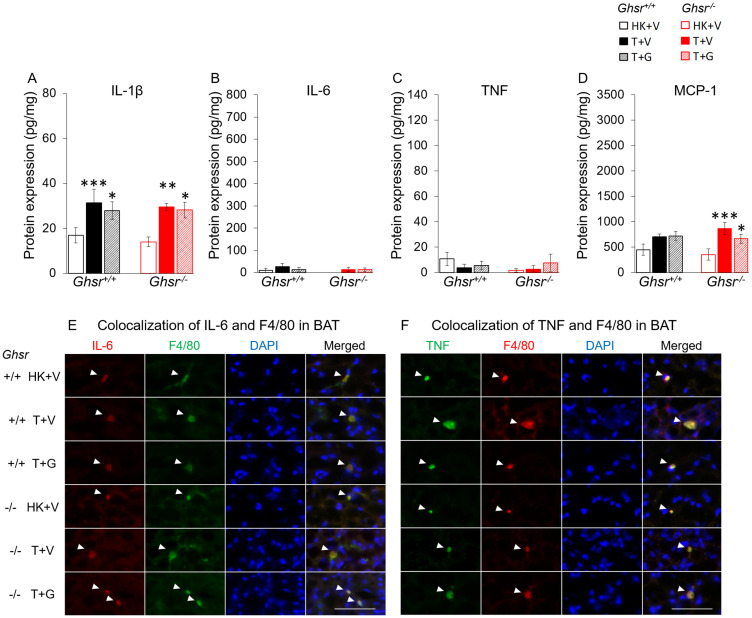
Figure 4. Effects of ghrelin on LLC-induced changes in inflammation and macrophages in BAT.
HK+V: heat-killed + vehicle; T+V: tumor + vehicle; T+G: tumor + ghrelin. Protein levels of inflammatory markers (A) IL-1β, (B) IL-6, and (C) TNF; and (D) macrophage marker MCP-1 in BAT (pg/mg). Two-way ANOVA was performed to detect genotype and treatment differences. * p < 0.05; ** p < 0.01; *** p < 0.001 compared to HK+V within the same genotype. # p < 0.05; ### p < 0.001 compared to T+V within the same genotype. No genotype difference was detected. Data are shown as mean ± SE. n = 6–7/group. (E and F) Colocalization of inflammation and macrophages in BAT. (E) Representative images of colocalization of inflammatory marker IL-6 and macrophage marker F4/80 in BAT (IL-6 in Texas red; F4/80 in FITC green; nuclei in DAPI blue). (F) Representative images of colocalization of inflammatory marker TNF and macrophage marker F4/80 in BAT (TNF in FITC green; F4/80 in Texas red; nuclei in DAPI blue). Positively stained inflammatory markers and colocalizations with macrophages are indicated by white arrows. Scale bars, 50 μm.

