. 2020 Aug 14;9:e52558. doi: 10.7554/eLife.52558

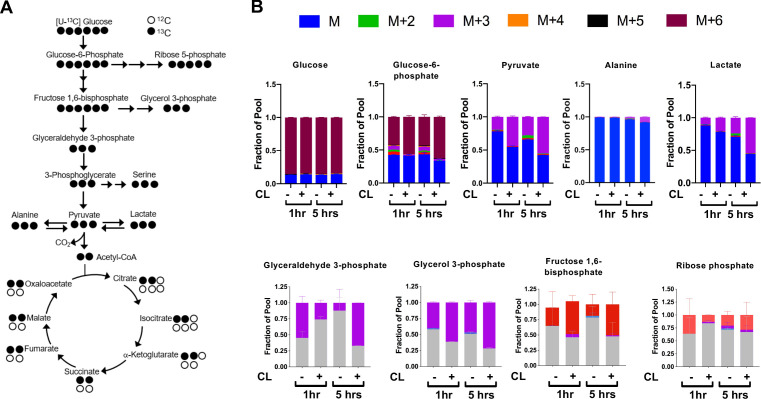
Figure 2. CL-316,243 stimulation of brown adipocytes leads to increased 13C-glucose flux.

(a) Atom mapping for [U-13C] glucose tracing into glycolysis and the TCA cycle. White balls are 12C atoms. Black balls are 13C atoms. (b) Tracing analysis from U-13C glucose in differentiated brown adipocytes treated with vehicle or 100 nM CL-316,243 for 5 hours(N = 3).

Figure 2.

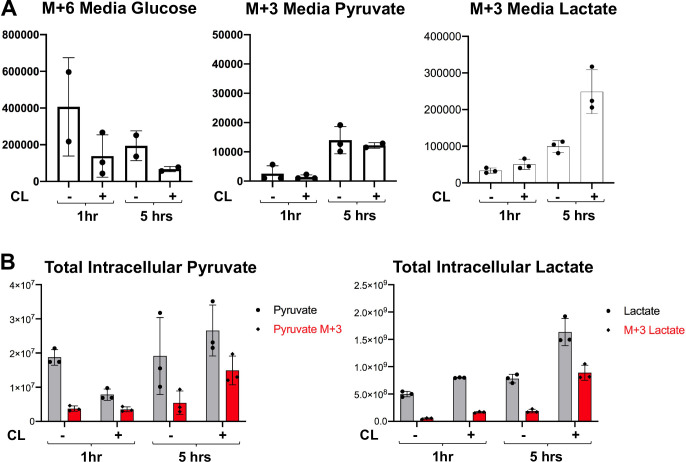
Figure 2—figure supplement 1. Metabolite tracing of brown adipocytes in response to β3-Adrenergic Receptor agonist.

Figure 2—figure supplement 1.

(a) 13C labeling of M+6 glucose and M+three pyruvate and lactate in the media of brown adipocytes treated with vehicle or 100 nM CL-316,243 for 1 or 5 hours (N = 3). (b) Total intracellular pyruvate and lactate (M and M+3) of brown adipocytes treated with vehicle or 100 nM CL-316,243 for 1 or 5 hours(N = 3).