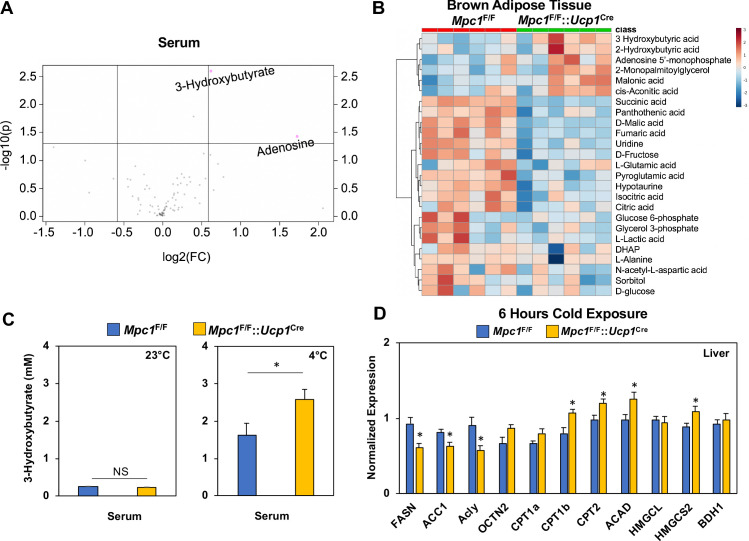
Figure 8. Conditional deletion of Mpc1 in brown fat leads to increased ketogenesis.
(a) Volcano plot showing changes in serum metabolites between Mpc1F/F and Mpc1F/F::Ucp1Cre mice housed at 4°C for 6 hr. N = 6. (b) Heat map of top 25 metabolites in BAT from Mpc1F/F and Mpc1F/F::Ucp1Cre mice housed at 4°C for 6 hr. Dendograms illustrate hierarchical clustering across metabolites (left) and genotypes (top). N = 6. Data was sum normalized, log transformed, and autoscaled. (c) Serum 3-hydroxybutyrate levels from Mpc1F/F and Mpc1F/F::Ucp1Cre mice housed at 23°C or 4°C for 6 hr. N = 6. (d) Gene expression analysis of livers from Mpc1F/F and Mpc1F/F::Ucp1Cre mice housed at 4°C for 6 hr. N = 6.
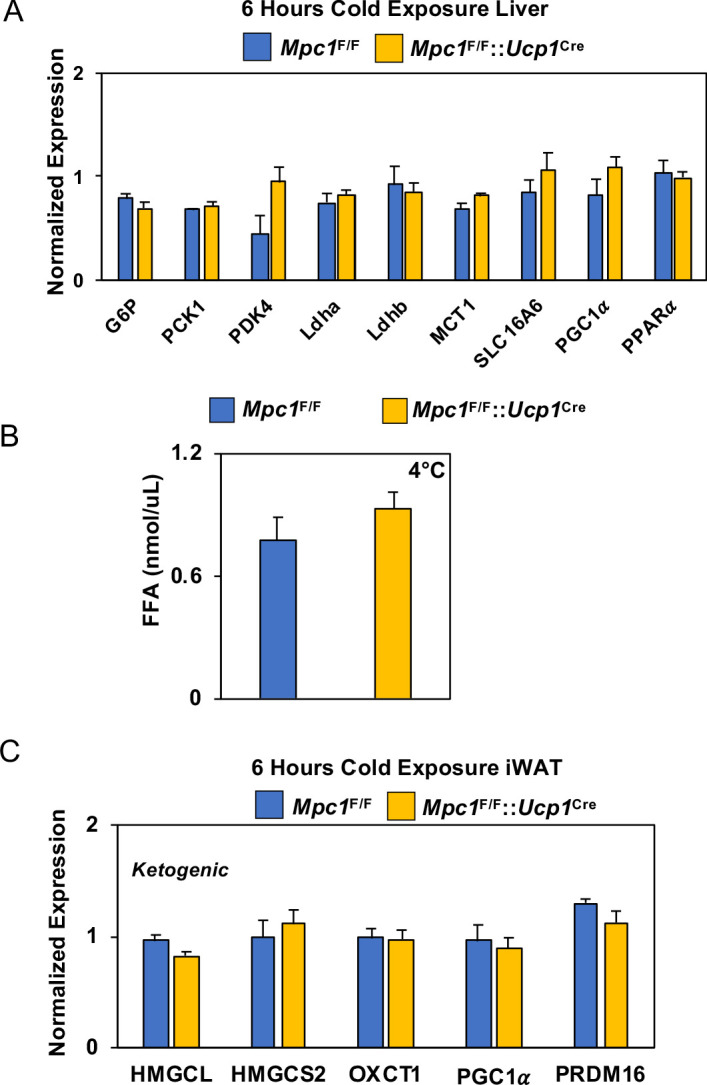
Figure 8—figure supplement 1. Gene expression analysis and serum FFA levels.


