. 2020 Sep 7;9:e58894. doi: 10.7554/eLife.58894

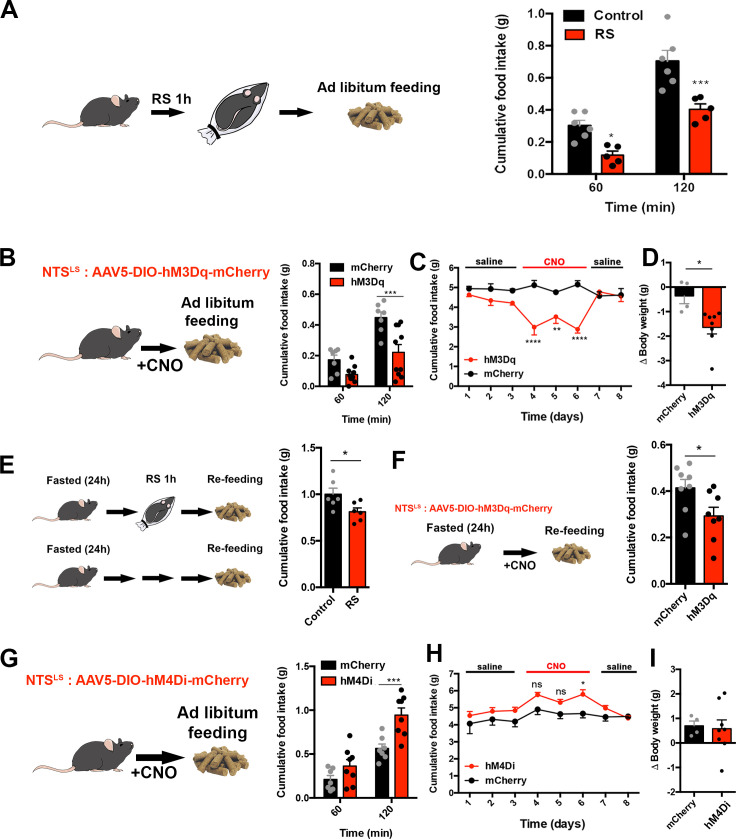
Figure 2. LSNts neurons regulate food intake and body weight in mice.

(A) Left panel, experimental scheme. Right panel, food intake, measured in grams (g), in control (black) and RS (red) mice after 60 and 120 min following RS. n = 5(RS), n = 6(control), Two-way ANOVA with post-hoc Bonferroni correction, Time: F(1,9)=175.9, p<0.0001; Subject: F(1,9)=16.86, p=0.003; Interaction: F(1,9)=4.975, p=0.0527. (B) Left panel, experimental scheme. Nts-cre mice were injected with an AAV encoding the hM3Dq activatory DREADD receptor in the LS. Middle panel, cumulative food intake, measured in grams (g) of control mCherry (black) and hM3Dq (red) expressing Nts-cre mice after 60 and 120 min following CNO injection. n = 7(mCherry), n = 10(hM3Dq), Two-way ANOVA with post-hoc Bonferroni correction, Time: F(1,15)=55.46, p<0.0001; Subject: F(1,15)=12.84, p=0.0027; Interaction: F(1,15)=5.45, p=0.034. (C) Daily food intake, measured in grams (g) daily during injections of saline (days 1–3, 7–8) or CNO (days 4–6) in control mCherry (black) or hM3Dq (red) expressing Nts-cre mice. n = 8; Two-way ANOVA with post-hoc Bonferroni correction, Time: F(7,72)=2.871, p=0.01; Subject: F(1,72)=46.92, p<0.0001; Interaction: F(7,72)=6.48, p<0.0001. (D) Body weight (delta), measured in grams (g) after 3 d of daily CNO injections in control mCherry (black) or hM3Dq (red) expressing Nts-cre mice. n = 8; Unpaired Student’s t-test, *p<0.05, t = 2.903, df = 10. (E) Left panel, experimental scheme. Right panel, cumulative food intake, measured in grams (g), in control naïve mice (control, black) or mice that underwent restraint stress (RS, red), measured 2 hr after re-feeding after an overnight fast, n = 6. Unpaired Student's t-test: T(10)=2.427, p=0.0356. (F) Left panel, experimental scheme. Right panel, cumulative food intake, measured in grams (g), in control mCherry (black) or hM3Dq (red) expressing Nts-cre mice, measured 2 hr following re-feeding after an overnight fast, n = 8, Paired Student’s t-test, *p<0.05, t = 3.171, df = 7. (G) Left panel, experimental scheme. Right panel, cumulative food intake, measured in grams (g), in control mCherry (black) and hM4Di (red) expressing Nts-cre mice after 60 and 120 min following saline injection. n = 7(mCherry), n = 8(hM4Di). Two-way ANOVA with post-hoc Bonferroni correction, Time: F(1,19)=415.8, p<0.0001; Subject: F(1,13)=1.042, p=0.326; Interaction: F(4,52)=2.839, p=0.0333. (H) Daily food intake, measured in grams (g) after daily injections of saline (days 1–3, 7–8) or CNO (days 4–6) in control mCherry (black) or hM4Di (red) expressing Nts-cre mice. n = 7; Two-way ANOVA with post-hoc Bonferroni correction, Time: F(7,96)=3.949, p=0.0008; Subject: F(1,96)=18.95, p<0.0001; Interaction: F(7,96)=0.876, p=0.5285. (I) Body weight (delta), measured in grams (g) after 3 d of daily CNO injections in control mCherry (black) or hM4Di (red) expressing Nts-cre mice. n = 8; Unpaired Student’s t-test, p=0.83, t = 0.2168, df = 10. Data are represented as mean ± SEM.

Figure 2.

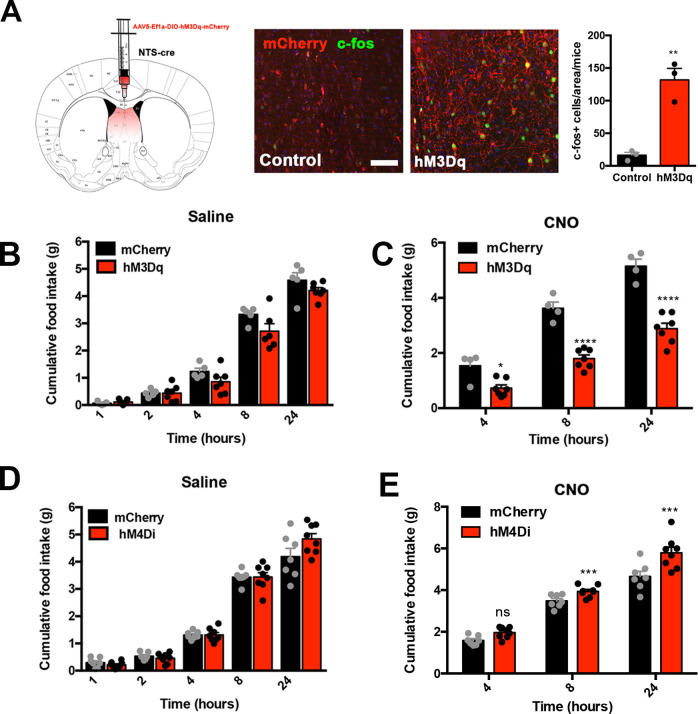
Figure 2—figure supplement 1. LSNts neurons regulate feeding.

Figure 2—figure supplement 1.

(A) Representative images of viral injection strategy and viral expression (mCherry, red) and c-fos (green) in control virus (left) and hM3Dq (right) injected mice following CNO injection. Right, quantification of c-fos+ cells in mCherry control (black) and hM3Dq (red) expressing mice. n=3, Unpaired Students’ t-test, p=0.003, t(4)=6.418. Scale bar, 25 um. (B) Food intake, measured in grams (g), in control mCherry (black) and hM3Dq (red) expressing Nts-cre mice 1 hour (h), 2h, 4h, 8h and 24h following saline injection. n=5(mCherry, n=5(hM3Dq). Mixed-model ANOVA with post-hoc Bonferroni correction (Time: F(2.33,22.72)=298.8, p<0.0001; Subject: F(1,10)=6.203, p=0.032; Interaction: F(4,39)=1.727, p=0.1637). (C) Food intake, measured in grams (g), in control mCherry (black) and hM3Dq (red) expressing Nts-cre mice 4 hour (h), 8h and 24h following CNO injection. n=7(mCherry), n=10(hM3Dq). Two-way ANOVA with post-hoc Bonferroni correction (Time: F(2,18)=184.5, p<0.0001; Subject: F(1,9)=60.03, p<0.0001; Interaction: F(2,18)=12.38, p=0.0004).(D) Food intake, measured in grams (g), in control mCherry (black) and hM4Di (red) expressing Nts-cre mice 1 hour (h), 2h, 4h, 8h and 24h following saline injection. n=7(mCherry), n=8(hM4Di). Two-way ANOVA with post-hoc Bonferroni correction (Time: F(1,19)=415.8, p<0.0001; Subject: F(1,13)=1.042, p=0.326; Interaction: F(4,52)=2.839, p=0.0333). (E) Food intake, measured in grams (g), in control mCherry (black) and hM4Di (red) expressing Nts-cre mice 4 hours (h), 8h and 24h following CNO injection. n=7(mCherry), n=8(hM3Dq). Two-way ANOVA with post-hoc Bonferroni correction (Time: F(2,18)=184.5, p<0.0001; Subject: F(9,18)=2.945, p=0.0245; Interaction: F(2,18)=12.38, p=0.004).
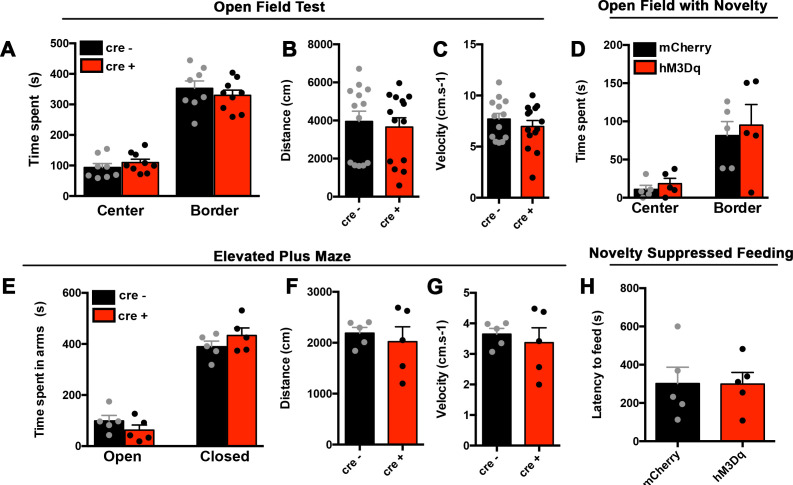
Figure 2—figure supplement 2. LSNts neurons do not regulate anxiety-like behaviors.

Figure 2—figure supplement 2.

(A) Time, measured in seconds (s), spent in the center and border of an open field in control mCherry (black) and hM3Dq (red) expressing Nts-cre mice. n = 8(mCherry), n = 9(hM3Dq). Two-way ANOVA with post-hoc Bonferroni correction, Subject: F(1,15)=0.071, p=0.794; Arena: F(1,15)=135.8, p<0.0001; Interaction: F(1.15) = 0.9093, p=0.355. (B) Distance, measured in centimeters (cm), traveled in the open field, in control mCherry (black) and hM3Dq (red) expressing Nts-cre mice. n = 13(mCherry), n = 14(hM3Dq), Unpaired Student's t-test, t(25)=0.403, p=0.69. (C) Velocity, measured as the cm per s (cm.s−1), in the open field, in control mCherry (black) and hM3Dq (red) expressing Nts-cre mice. n = 13(mCherry), n = 14(hM3Dq), Unpaired Student's t-test, t(25)=0.915, p=0.369. (D) Time, measured in seconds (s), spent in the center and border of an open field with novelty in control mCherry (black) and hM3Dq (red) expressing Nts-cre mice, n = 5. Two-way ANOVA with post-hoc Bonferroni correction, Subject: F(1,8)=0.358, p=0.566; Arena: F(1,8)=21.54, p=0.0017; Interaction: F(1,8)=0.039, p=0.847. (E) Time, measured in seconds (s), spent in the open and closed arms of an elevated plus maze in control mCherry (black) and hM3Dq (red) expressing Nts-cre mice, n = 5. Two-way ANOVA with post-hoc Bonferroni correction, Arm: F(1,8)=111.2, p<0.0001; Subject: F(1,8)=0.137, p=0.72; Interaction: F(1,8)=1.641, p=0.236. (F) Distance, measured in centimeters (cm), traveled in the elevated plus maze, in control mCherry (black) and hM3Dq (red) expressing Nts-cre mice, n = 5, Unpaired Student's t-test, t(8)=0.5347, p=0.6074. (G) Velocity, measured as the cm per s (cm.s−1), in the elevated plus maze, in control mCherry (black) and hM3Dq (red) expressing Nts-cre mice, n = 5, Unpaired Student's t-test, t(8)=0.533, p=0.608. (H) Latency to feed, measured in seconds (s), in a novelty suppressed feeding task, in control mCherry (black) and hM3Dq (red) expressing Nts-cre mice. n = 5, Unpaired Student's t-test, t(8)=0.027, p=0.979. Data are represented as mean ± SEM.