. 2020 Sep 7;9:e58894. doi: 10.7554/eLife.58894

Figure 4. LSNts- > LH projection regulates food intake in mice.

(A) Representative images of the LS injection site (left) and terminals in the lateral hypothalamus (left) of Nts-cre mice injected with a control mCherry reporter virus. Atlas images above the representative images depict the area of magnification. Scale bar, 50 μm. (B) Representative image of cells labeled in the lateral hypothalamus (right) of Nts-cre mice injected with the anterograde tracer H129ΔTK-tdTomato in the LS. Middle, atlas image depicting the area of magnification to the right. Scale bar, 25 μm. (C) Left, experimental scheme depicting mice injected with AAV expressing Chr2 or control mCherry into the LS and an optic fiber positioned over the lateral hypothalamus. Middle, food intake was measured in an OFF-ON-OFF paradigm. Right, food intake measured in grams (g) of control mCherry (black) or Chr2 (red) expressing mice before (OFF), during (ON) and after (OFF) laser stimulation. n = 11, Two-way ANOVA with post-hoc Bonferroni correction, Epoch: F(2,40)=38.47, p<0.0001; Subject: F(1,20)=0.069, p=0.796; Interaction: F(2,40)=10.94, p=0.0002. Data are represented as mean ± SEM.

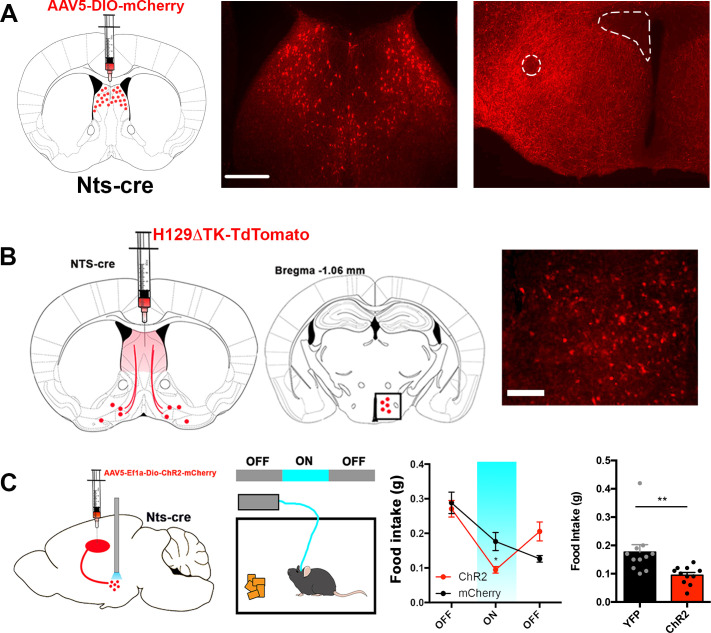
Figure 4.

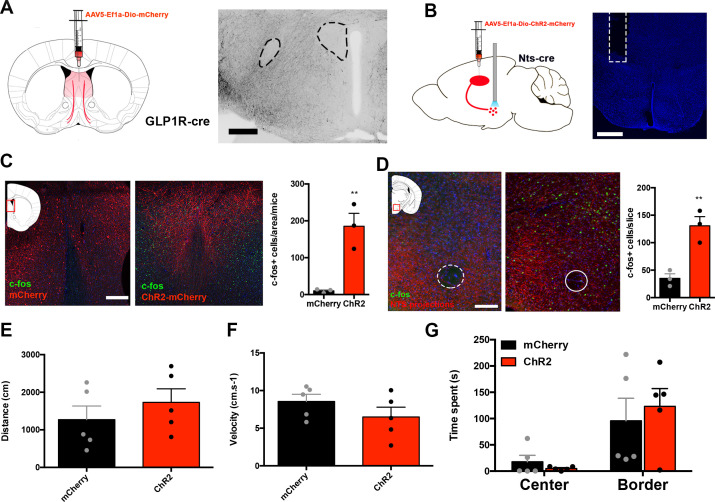
Figure 4—figure supplement 1. LSNts → LH does not regulate anxiety or locomotion.

Figure 4—figure supplement 1.

(A) Left, experimental scheme of Glp1r-cre mice injected with AAV expressing cre-dependent mCherry in the lateral septum. Right, representative image of Glp1r fibers in the lateral hypothalamus. Scale bars are 100 μm. (B) Left, experimental scheme of Nts-cre mice injected with AAV expressing Chr2 in the lateral septum and optic fibers in the lateral hypothalamus. Right, Representative image of fiber optic path in the lateral hypothalamus. Scale bars are 100 μm. (C) Left, representative images of c-fos (green) and mCherry (red) in control mCherry (left) and Chr2 (right) expressing Nts-cre mice injected with CNO. Right, quantification of c-fos+ cells in control (black) and Chr2 (red) mice. n = 3, Unpaired Student's t-test, t(4)=4.999, p=0.008. Scale bar, 50 μm. (D) Left, representative images of c-fos (red) and mCherry projections (green) in the lateral hypothalamus of Nts-cre mice expressing control mCherry (left) or Chr2 (right) virus injected with CNO. n = 3, Unpaired Student's t-test, t(4)=5.089, p=0.007. Scale bar, 50 μm.(E) Distance, measured in centimeters (cm), traveled in the elevated plus maze, in control mCherry (black) and Chr2 (red) expressing Nts-cre mice. n = 5, Unpaired Student's t-test, t(8)=0.9092, p=0.39. (F) Velocity, measured as the cm per s (cm.s−1), in the elevated plus maze, in control mCherry (black) and Chr2 (red) expressing Nts-cre mice. n = 5, Unpaired Student's t-test, t(8)=1.291, p=0.233. (G) Time, measured in seconds (s), spent in the center and border of an open field in control mCherry (black) and Chr2 (red) expressing Nts-cre mice. n = 5. Two-way ANOVA with post-hoc Bonferroni correction, Subject: F(1,8)=0.051, p=0.827; Border/Center: F(1,8)=18.48, p=0.0026; Interaction: F(1,8)=0.791, p=0.4. Data are represented as mean ± SEM.