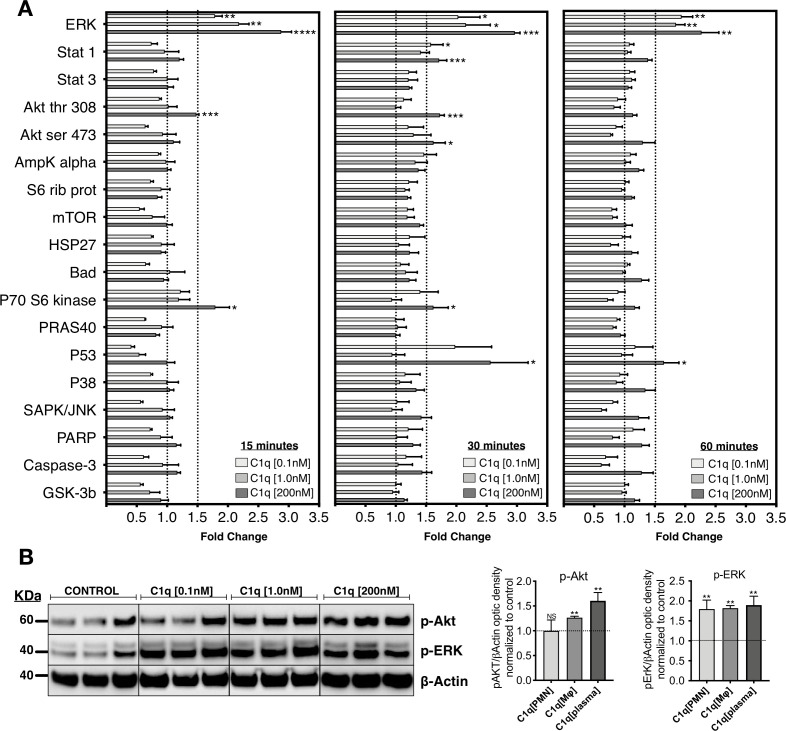
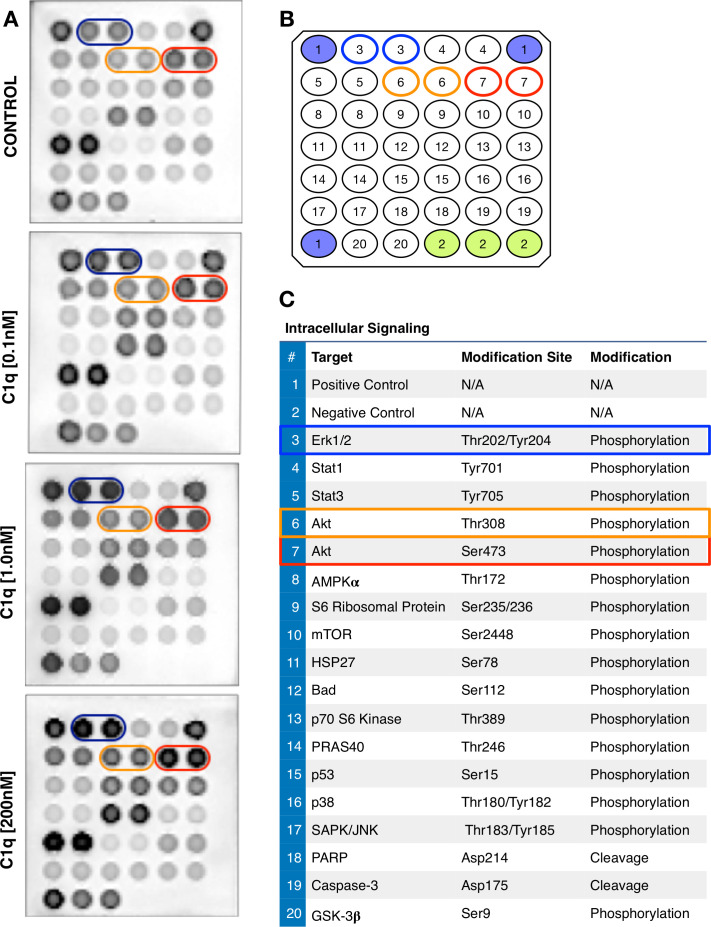
Figure 1. C1q induces intracellular signaling activation in hNSC.
(A) Phosphoarray analysis quantification of hNSC exposed to C1q [0.1 nM], [1.0 nM], or [200 nM] concentrations for 15, 30, or 60 min. Data show mean ± SEM (N = 3 biological replicates per condition) for quantified optical intensity, normalized to control (dashed line = 1). In addition to statistical analysis, using one-sample t-test (*p≤0.05, **p≤0.01, ***p≤0.001), a minimum threshold of 1.5-fold activation (dashed line) was set for statistical significance. (B) ERK and Akt activation was verified using western blot in lysates from hNSC exposed to C1q [0.1 nM], [1.0 nM], or [200 nM] concentrations for 60 min. p-ERK and p-Akt band intensities were normalized to β-actin. Data show mean ± SEM (N = 3 biological replicates per condition) for quantified optical intensity normalized to control (dashed line). Statistical analysis using one-sample t-test (NS, not significant; *p≤0.05, **p≤0.01, ***p≤0.001).


