. 2020 Sep 7;9:e55732. doi: 10.7554/eLife.55732

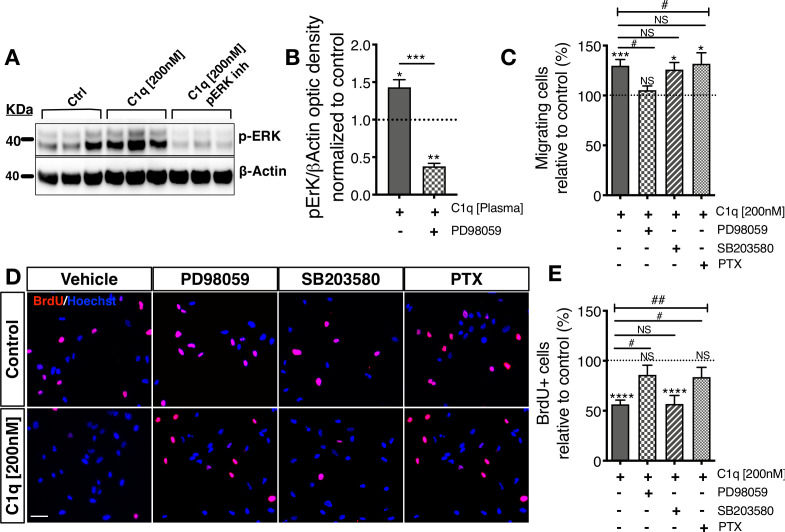
Figure 4. Distinct cellular signaling pathways control different C1q induced hNSC behavior.

(A,B) Western blot analysis in cells treated with the MEK/ERK pathway inhibitor PD89059 verifies effective p-ERK inhibition in cells exposed to C1q [200 nM] for 60 min. Optical densities were normalized to untreated controls (dashed line). Statistical analysis using one-sample t-test (*p≤0.05, **p≤0.01) for comparison with control and Student’s t-test for comparison between conditions as indicated (***p≤0.001). N = 3 biological replicates. (C) C1q [200 nM] induces hNSC chemotaxis in transwell migration assays (shown also in Figure 4—figure supplement 1D), which is blocked by PD89059 inhibition of p-ERK. No effect was observed with either a GPCR inhibitor (Pertussis toxin; PTX) or p38 MAPK inhibitor (SB203580). (D,E) C1q [200 nM] decreases hNSC proliferation in vitro as analyzed by BrdU incorporation (shown also in Figure 4—figure supplement 1E–F), which is blocked by either PD89059 or PTX treatment. No effect was observed with the p38 inhibitor SB203580. (D) Representative pictures of BrdU+ cells in control hNSC or hNSC treated with C1q [200 nM] and pathway inhibitors as indicated. (E) Brdu+ nuclei quantification (%). Data shows mean ± SEM normalized to untreated controls (dashed line). Statistical analysis using one-sample t-test (NS, not significant; *p≤0.05, **p≤0.01, ***p≤0.001) for comparison with untreated controls, and using one-way ANOVA (#) p<0.05 followed by Tukey’s post-hoc t-tests as indicated (NS, not significant; #p≤0.05) for comparison between conditions, N = 4 biological replicates.

Figure 4.

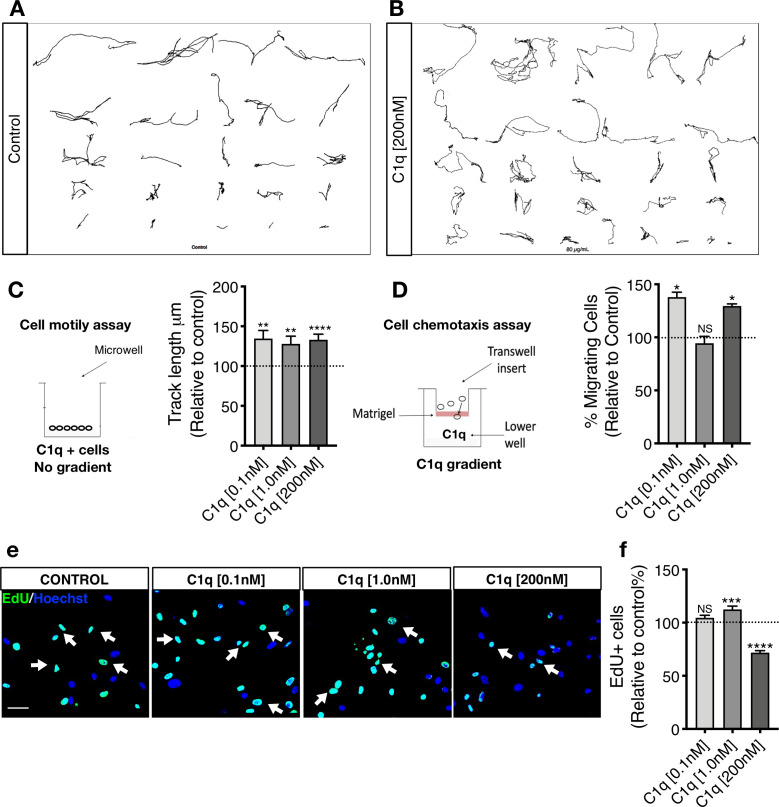
Figure 4—figure supplement 1. C1q induces NSC motility and chemotaxis in vitro.

Figure 4—figure supplement 1.

(A-C) Exposure to C1q in the absence of a gradient increases hNSC motility independent of concentration. Manual tracking of 20 randomly selected cells per biological replicate in live-cell imaging assay reveals that C1q increases hNSC motility as measured by track length, independent of C1q concentration. Representative image of 20 manual tracks from cells in (A) control and (B) C1q [200 nM] condition. (C) Data normalized to untreated control (dashed line). Statistical analysis using one-sample t-test (*p≤0.05, **p≤0.01; N = 3 biological replicates) for comparison with control. ANOVA analysis for comparison between groups, p=0.8682. (D) Exposure to C1q in transwell assay for analysis of chemotaxis reveals that C1q induces hNSC migration in a concentration-dependent manner, with maximal effects at 0.1 nM and 200 nM. Data normalized to untreated control (dashed line). Statistical analysis using one-sample t-test for comparison with control (*p≤0.05, **p≤0.01; n = 4 biological replicates with technical triplicates). ANOVA analysis for comparison between groups, p=0.0005. (E-F) EdU incorporation analysis reveals that C1q modulates hNSC proliferation. Representative image of Edu+ nuclei (green, white arrows) in hNSC exposed to C1q [0.1 nM], [1.0 nM], or [200 nM] for 2DIV. Scale bars 30 µm. (F) Edu+ nuclei quantification. Data shows untreated control (dashed line; mean ± SEM). Statistical analysis using one-sample t-test for comparison with control (NS = not significant p>0.05, ***p≤0.001, ****p≤0.0001; 10 random images/experiment (N), N = 4 biological replicates, averaging 140 ± 60 cells/image. ANOVA analysis for comparison between groups, p≤0.0001.