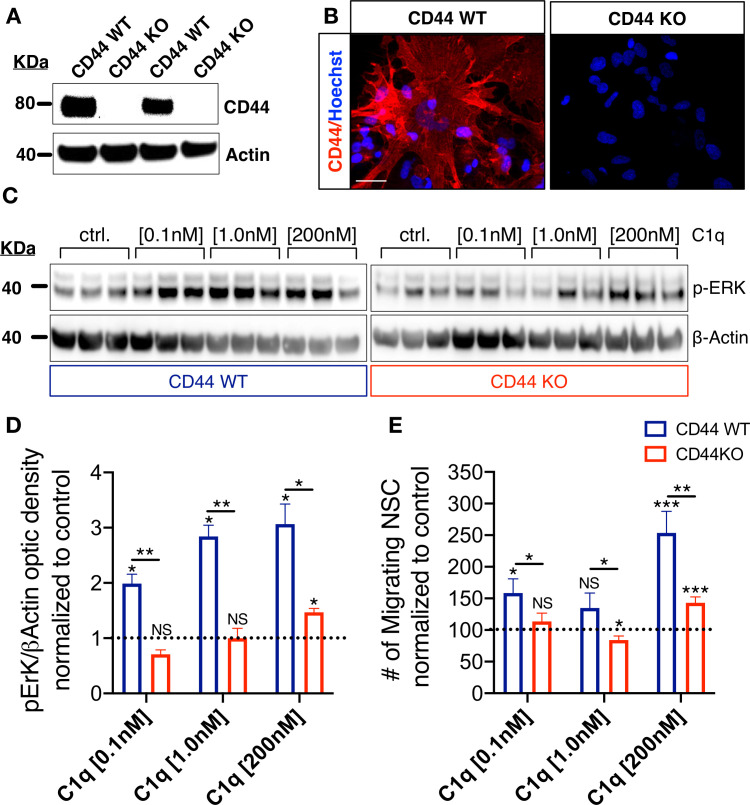
Figure 5. CD44 mediates C1q-induced ERK signaling activation and chemotaxis in hNSC in vitro.
(A,B) CD44 expression profile in WT but not in CD44 KO hNSC was verified by (A) western blot and (B) Immunocytochemistry (scale bar 30 µm). (C,D) p-ERK western blot analysis of protein lysates from WT and CD44 KO hNSC shows that C1q-induced ERK activation is completely blocked in CD44 KO hNSC at C1q [0.1 nM] and [1 nM], and dramatically attenuated at C1q [200 nM]. p-ERK band optical intensities were normalized to β-actin within condition. Data show mean ± SEM (N = 3 biological replicates per condition) normalized to untreated controls for comparison between conditions (dashed line). Statistical analysis using one-sample t-test (NS, not significant; *p≤0.05) for comparison with control and Student’s t-test for comparison between WT and CD44 KO hNSC as indicated (*p≤0.05, **p≤0.01). (E) Transwell chemotaxis assay reveals that C1q-induced hNSC chemotaxis is completely blocked in CD44 KO hNSC at C1q [0.1 nM] and dramatically attenuated at C1q [200 nM]. Data show mean ± SEM (N = 3 biological replicates per condition) normalized to untreated controls (dashed line). Statistical analysis using one-sample t-test (NS, not significant; *p≤0.05) for comparison with control and Student’s t-test for comparison between WT and CD44 KO hNSC as indicated (*p≤0.05, **p≤0.01).

