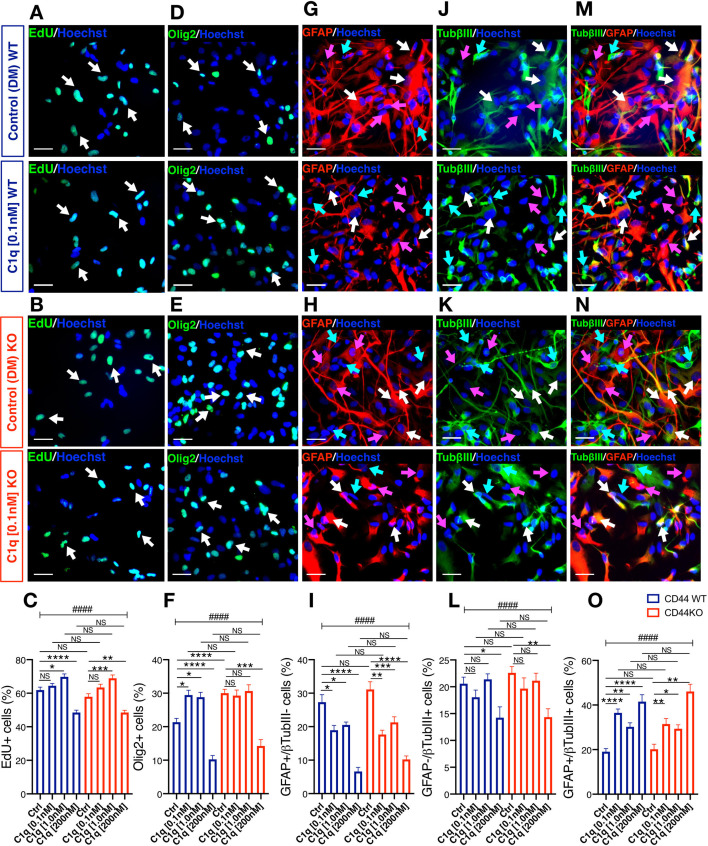
Figure 6. C1q modulation of hNSC proliferation and fate is CD44 independent.
(A-C) EdU incorporation analysis reveals that C1q exposure for 2DIV (0.1 nM–200 nM vs. control media, as indicated) exerts comparable effects on hNSC proliferation in CD44 WT and KO. Representative images (A, B; white arrows, scale bar 30 µm) and quantification (C) of EdU+ nuclei of CD44 WT (blue) and KO (red) hNSC. (D-O) Immunohistochemical fate analysis reveals that C1q exposure for 14DIV in DM (0.1 nM–200 nM vs. control media, as indicated) exerts comparable effects on hNSC fate in CD44 WT and KO. hNSC were immunolabeled for Olig2 (green) to identify oligodendroglial lineage cells, and doubled immunolabeled for glial fibrillary acidic protein (GFAP, red) and Tubulin βIII (TubβIII, green) to identify astroglial and neuronal lineage cells, respectively. Representative images and quantification of nuclear Olig2+ oligodendroglial cells (D-F; white arrows, scale bar 30 µm), GFAP+/TubβIII- astroglial cells (G-I; pink arrows, scale bar 30 µm), GFAP-/TubβIII+ neuronal cells (j-l, green arrows, scale bar 30 µm), and GFAP+/TubβIII+ double-positive ‘undecided’ cells (M-O, white arrows, scale bar 30 µm). Data represent average number of cells as a percentage of total nuclei ± SEM of EdU labeled or immunolabeled cells obtained from 10 random fields/experiment (N = 4 biological replicates for each label and condition; average 140 ± 60 cells/field). Statistical analysis was performed using one-way ANOVA (####p≤0.0001) followed by Tukey’s post-hoc t-tests as indicated (NS, not significant; *p≤0.05, **p≤0.01, ***p≤0.001, ****p≤0.0001). No significant differences were observed between WT and CD44 KO hNSC in response to C1q at any tested C1q concentration (Tukey post-hoc t-tests p≥0.7891 for all comparisons).

