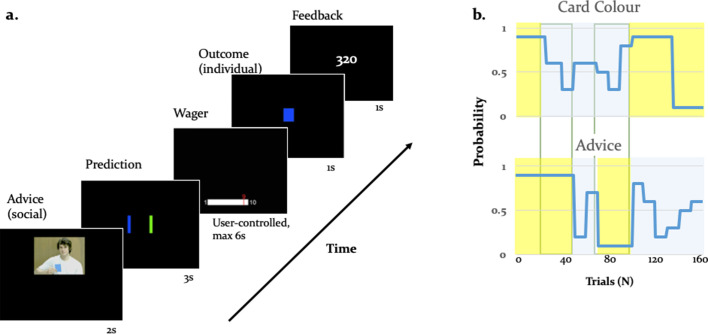
Figure 1. Experimental paradigm.
(a) Binary lottery game requiring arbitration between individual experience and social information. Volunteers predicted the outcome of a binary lottery, that is whether a blue or green card would be drawn. They could base predictions on two sources of information: advice from a gender-matched advisor (video, presented for 2 s) who was better informed about the color of the drawn card, and on an estimate about the statistical likelihood of the cards being one or the other color that the participant had to infer from own experience (outcome, 1 s). After predicting the color of the rewarded lottery card (user-controlled, maximum 3 s), participants also wagered one to ten points (user-controlled, maximum 6 s), which they would win or lose depending on whether the prediction was right or wrong. After the outcome, participants viewed their cumulative score on the feedback screen (1 s). (b) Contingencies of individual reward and social advice information: Card color probability corresponds to the likelihood of a given color (e.g. blue) being rewarded. The probabilities were matched on average for the two information sources (55% for the card color information and 56% for the advice information). Additionally, the two sources of information were uncorrelated as illustrated by phases of low (yellow) and high (light grey) volatility, enabling a factorial analysis of information source and volatility.


