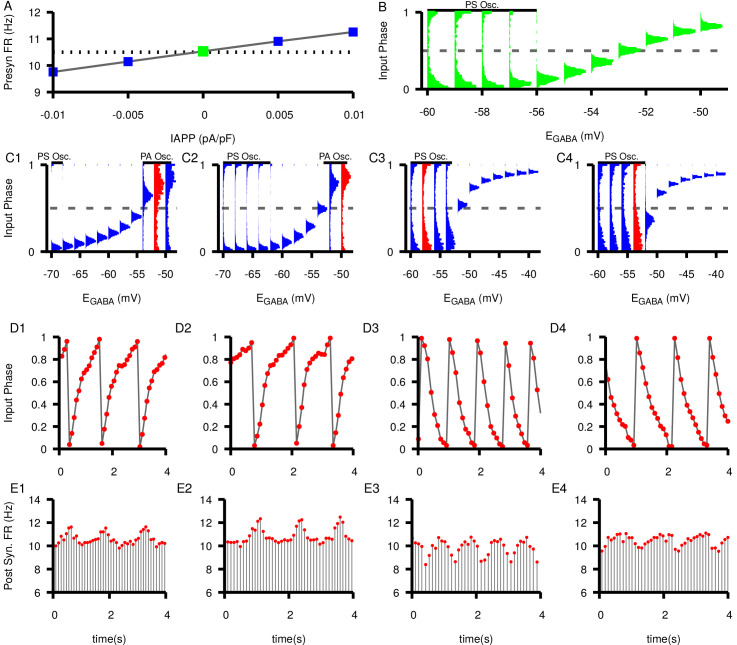
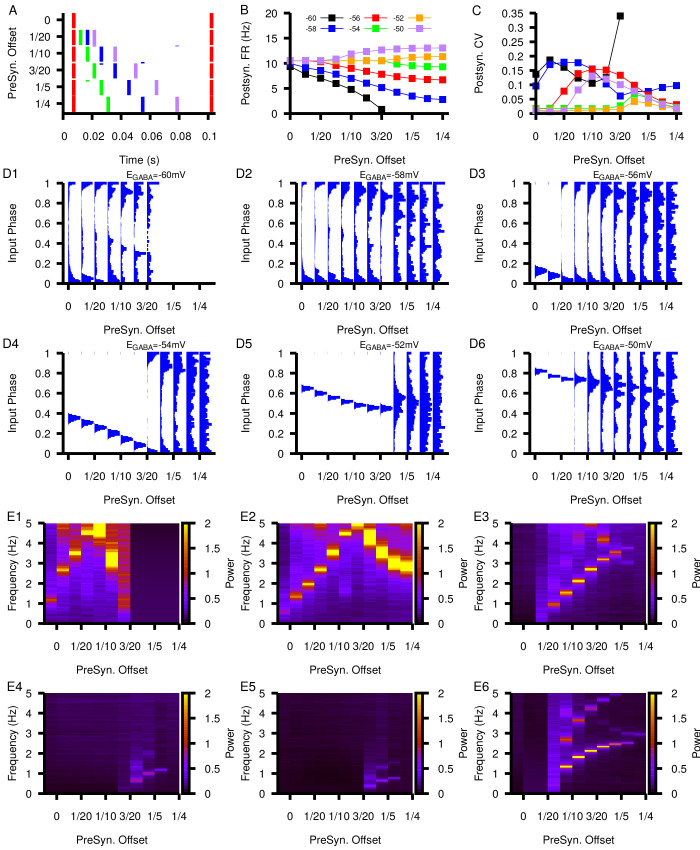
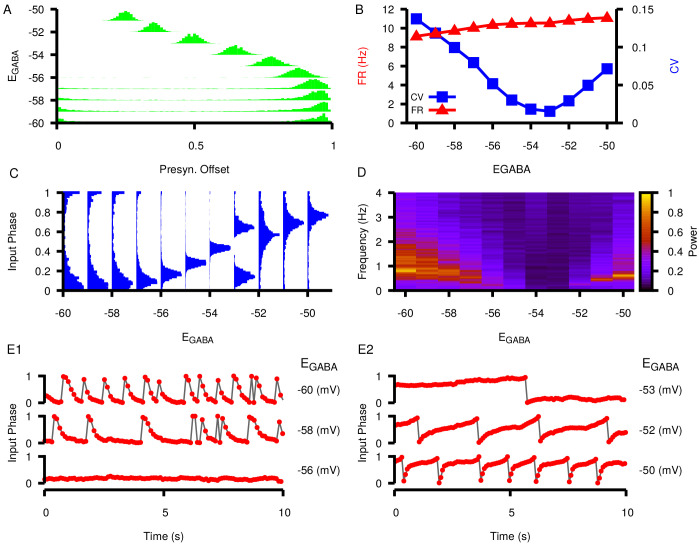
Figure 10. Effects of changing the presynaptic firing rate on synchrony and postsynaptic oscillations in a feed-forward SNr neuron pair.
(A) Tuning curve for presynaptic firing rate (FR) versus applied current, . Dashed line indicates the baseline firing rate (10.5 Hz) with no applied current. (B) Histograms of the input phase in the postsynaptic neuron under baseline conditions (). (C1–C4) Input phase histograms for different presynaptic firing rates (9.76 Hz, 10.15 Hz, 10.91 Hz, 11.26 Hz from left to right). ranges are not the same in all panels. Regions of phase slipping (PS) and phase advancing (PA) oscillations are each indicated by a solid horizontal bar. Example oscillations in input phase (D1–D4) and postsynaptic firing rate (E1–E4) at specific values of for different presynaptic firing rates highlighted in red for the corresponding D panels. Notice that the PA oscillations in C1-2 and D1-2 result in periodic increases in the postsynaptic firing rate in E1-2 whereas PS oscillations in C3-4 and D3-4 result in periodic decreases in firing rate in E3-4.

