. 2020 Sep 7;9:e55592. doi: 10.7554/eLife.55592

Figure 13. Tonic somatic Cl- conductance affects somatic and dendritic EGABA and tunes SNr responses to Str inputs.

(A) Raster plot of spikes in the simulation of an SNr network model containing 50 simulated neurons that receive tonic somatic inhibition from GPe projections. (B) Integrated SNr population activity gives a mean firing rate of about 23 Hz, as seen in in vivo conditions (Freeze et al., 2013; Mastro et al., 2017; Willard et al., 2019). (C) Increasing tonic Cl- depolarizes somatic and dendritic EGABA. (D) Ramping Str synaptic inputs used to represent evidence accumulation in a perceptual decision-making task. (E) Inhibition and pause generation in the SNr during evidence accumulation/ramping Str activity, for two different tonic somatic Cl- conductances. (F) Increasing the tonic Cl- conductance lengthens Tpause, the time for the SNr firing rate to drop below threshold (colors correspond to threshold levels in E). If the tonic conductance becomes too great, then SNr firing cannot be pushed to arbitrarily low rates. .

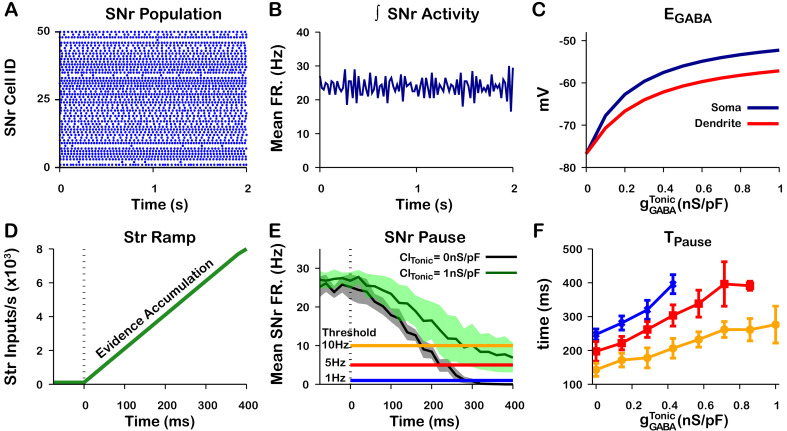
Figure 13.

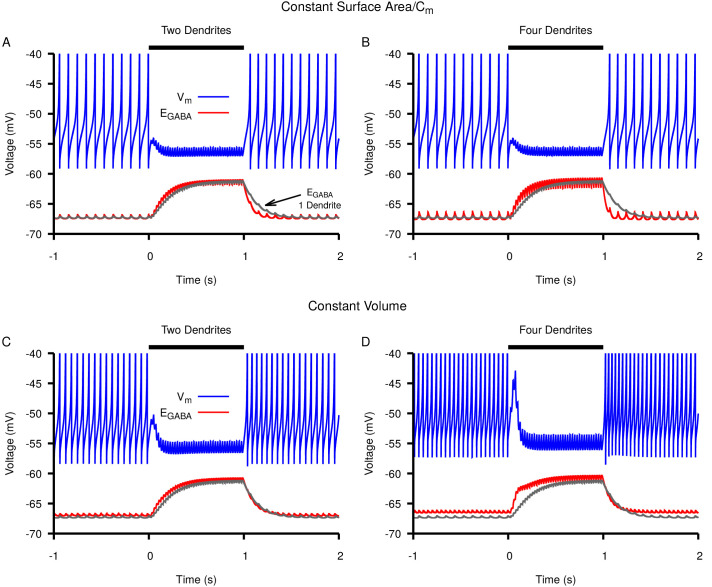
Figure 13—figure supplement 1. Switching from a single dendrite to multiple thin dendrites increases rate but not magnitude of Cl- accumulation and subsequent depolarization of EGABA in response to simulated 40Hz Str stimulation.

Figure 13—figure supplement 1.

Neuronal response (blue) and EGABA dynamics (red) in a neuron with (A,C) two or (B,D) four thin dendrites. For comparison EGABA dynamics in a neuron with a single dendrite is shown in gray in all panels. The total capacitance and surface area of the dendritic compartments in A and B matched that of the single dendrite; the total volume of the dendritic compartments in C and D matched that of the single dendrite. The stimulation period is from 0–1 s and is indicated by the horizontal black bar.
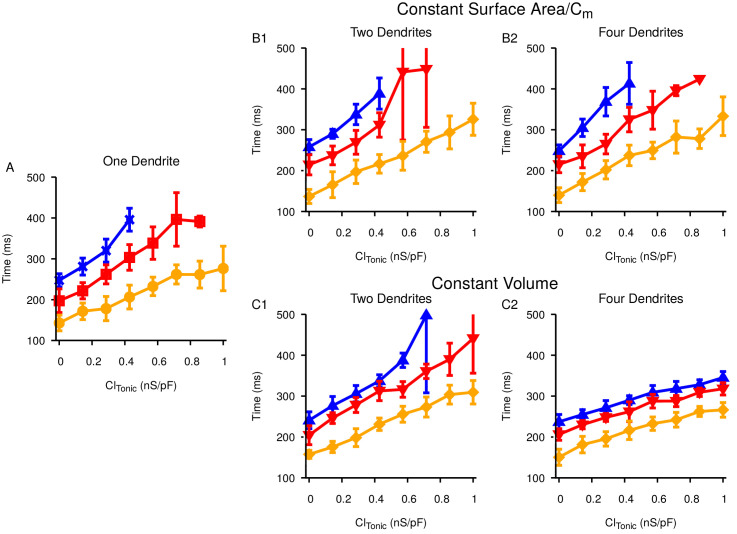
Figure 13—figure supplement 2. Increasing the number of dendrites has no qualitative effect on the the time it takes to generate a pause in SNr activity in response to ramping Str activity.

Figure 13—figure supplement 2.

Relationship between the tonic Cl- conductance and Tpause for (A) one dendrite, (B) two (B1) or four (B2) dendrites with total surface area and capacitance matched to the single dendrite, and (C) two (C1) or four (C2) dendrites with total volume matched to the single dendrite. Colors correspond to three different pause thresholds, defined by SNr firing rates, as in Figure 11E in the main manuscript.