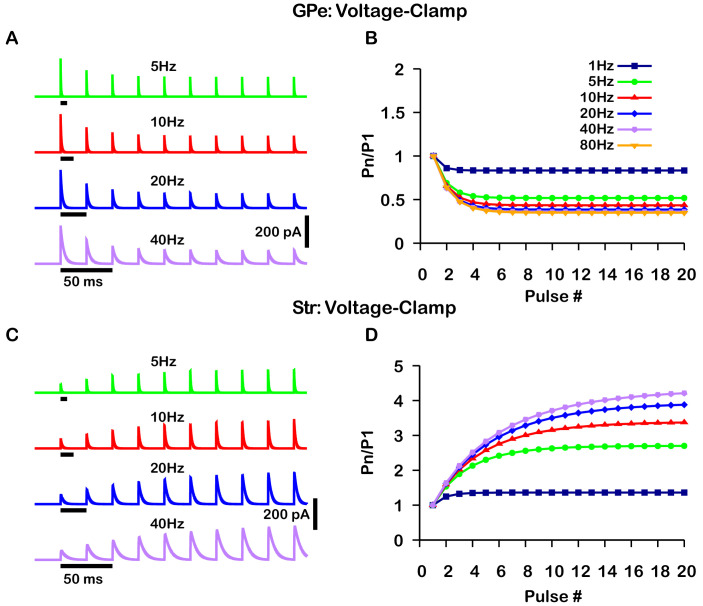
Figure 2. Simulated short-term synaptic depression and facilitation of GABAergic synapses originating from GPe neurons of the indirect pathway (A and B) and Str neurons of the direct pathway (C and D) under voltage clamp.
For the GPe and Str simulations, the left traces (A and C) show current and right panels (B and D) show the pared pulse ratios (PPR) resulting from repeated synaptic stimulation at different frequencies. The amplitude of each IPSC (Pn) was normalized to the amplitude of the first evoked IPSC (P1). For this set of simulations the membrane potential was held at and for the somatic and dendritic compartments was held fixed at –72 mV. Model parameters and behavior were tuned to match voltage-clamp data from Connelly et al., 2010.

