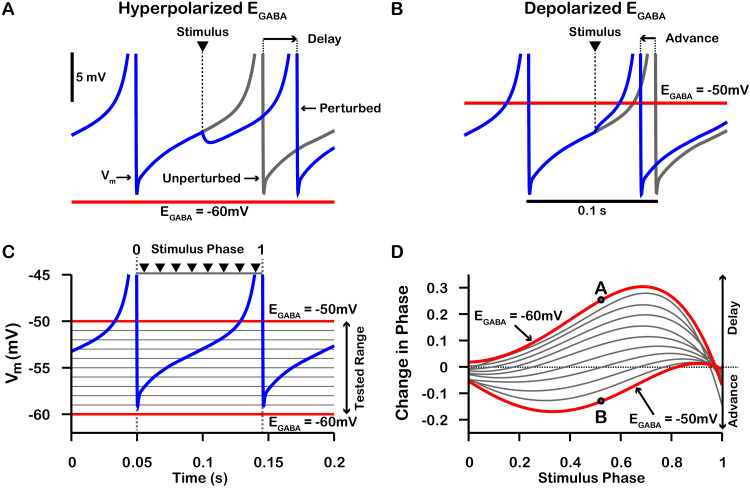
Figure 7. Phase response curves (PRCs) of the model SNr neuron depend on .
(A and B) Example traces illustrating the effect of a single GABAergic synaptic input on the phase of spiking in a simulated SNr neuron for hyperpolarized and depolarized , respectively. (C) For an ongoing voltage oscillation of a spiking SNr neuron (blue trace), we define a phase variable as progressing from 0 immediately after a spike to one at the peak of a spike. As is varied from –60 mV to –50 mV, progressively more of the SNr voltage trace lies below , where GABAergic inputs have depolarizing effects. (D) PRCs computed for a model SNr neuron in response to GABAergic input stimuli arriving at different phases of an ongoing SNr oscillation. As is varied from –60 mV to –50 mV, the PRC transitions from a curve showing a delay of the next spike for most stimulus arrival phases, through some biphasic regimes, to a curve showing an advance of the next spike for almost all possible phases. In panel D, the A and B labels at approximately 0.5 phase on the and PRCs correspond to the examples shown in panels A and B. The conductance of the synaptic input was fixed at 0.1 nS/pF in order to produce deflections in Vm for hyperpolarized that are consistent with data presented in Higgs and Wilson, 2016.

