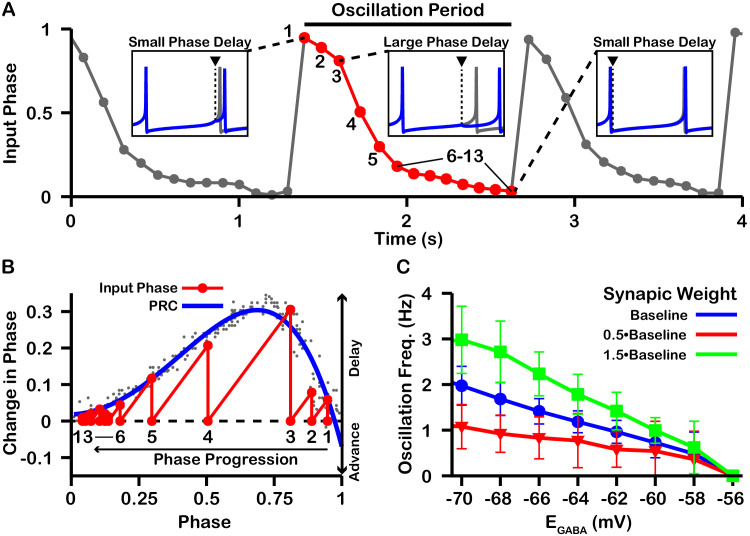
Figure 9. Characterization of phase slipping oscillations in the unidirectionally connected two-neuron network.
(A) Illustration of the phase of the postsynaptic neuron at the moment when it receives each input from the presynaptic neuron (input phase) for the unidirectionally connected two neuron network as a function of time for . Dots denote phases of the postsynaptic neuron when the presynaptic neuron spikes. The phase value of 1 corresponds to the postsynaptic neuron being at spike threshold. Insets show the timing of the presynaptic neuron spike (black triangle/dashed line), the phase of the postsynaptic neuron spike after it receives the input (blue), and the spike train of the postsynaptic neuron in the absence of input (gray). The red cycle is used in B. (B) Overlay of the PRC generated for and the resulting progression of phase for one full phase slipping oscillation. Light gray dots indicate the data points used to generate the blue PRC. Recall that positive changes in phase correspond to delays. (C) The frequency of phase slipping increases as decreases, with a steeper relationship for larger synaptic weight () between the SNr neurons. .

