
Figure 4.
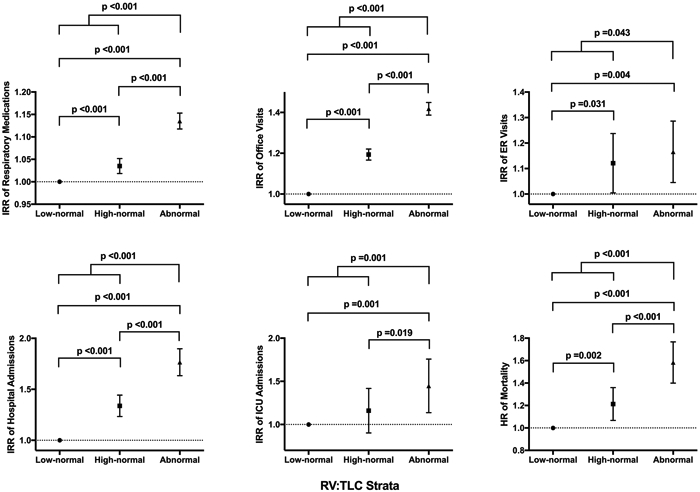
Associations of healthcare outcomes with RV:TLC strata. Graphs represent incident rate ratio (IRR) and hazard ratio (HR) with 95% CIs from Poisson and Cox proportional hazard regression analyses, respectively, of the association between healthcare outcomes and RV:TLC strata relative to the reference group (subjects with low-normal RV:TLC). Bold values represent significant p values. FEF25–75, maximum airflow at mid-lung volume; RV, residual volume; TLC, total lung capacity.