
Figure 5.
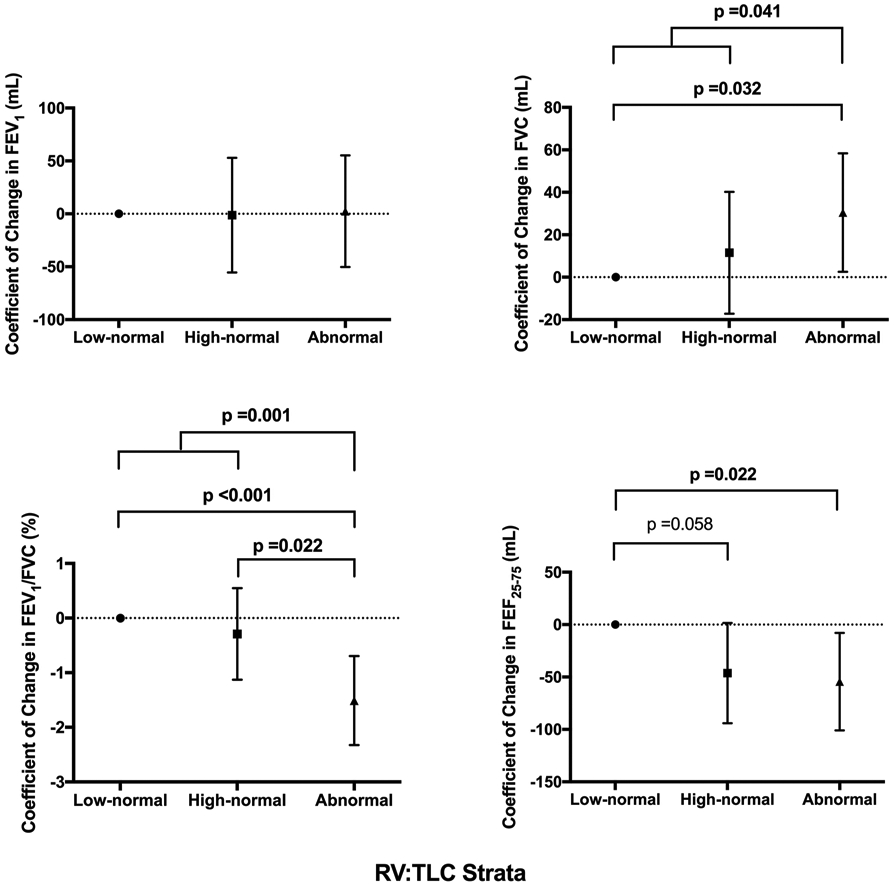
Comparison of change in airflow indices on follow-up spirometry across the RV:TLC strata. Graphs represent coefficient of change with 95% CIs in airflow indices across the RV:TLC strata relative to the reference group (subjects with low-normal RV:TLC) from mixed effect linear regression modelling with adjustment for age, sex, height and time to follow-up spirometry. Bold values represent significant p values. FEF25–75, maximum airflow at mid-lung volume; RV, residual volume; TLC, total lung capacity.