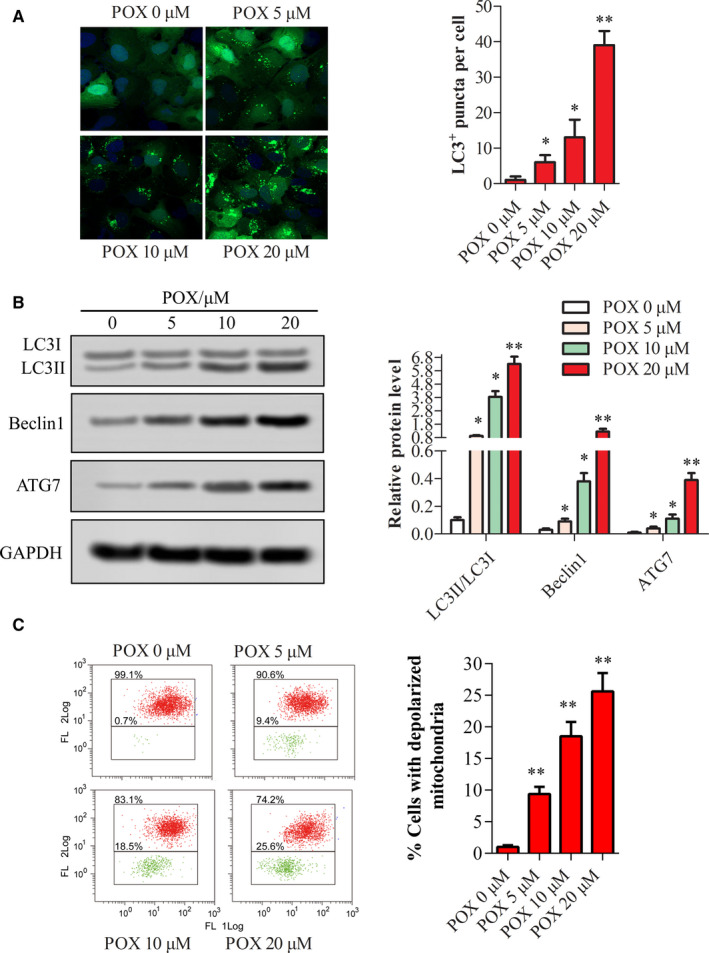
FIGURE 4.

Change in autophagy and mitochondrial membrane potential with treatment of Puerarin 6″‐O‐xyloside in HepG2 cells. GFP‐LC3 plasmid was transfected into HepG2 cells, then treated with 0, 5, 10, and 20 μmol/L of Puerarin 6″‐O‐xyloside for 24 h and (A) LC3 puncta per cells were counted with Image Pro Plus, Blue fluorescence form DAPI and green fluorescence were GFP‐LC3B. (B) Relative expression of autophagy‐related proteins in cells tested by western blotting. (C) Mitochondrial membrane potential measured by JC‐1‐labeled flow cytometry. When mitochondrial membrane potential loss happens, JC‐1 in cytoplasm captures the leaked proton and turns green. *P < .05 and **P < .01 compared with no Puerarin 6″‐O‐xyloside treatment by t test of at least three replicates. POX: Puerarin 6″‐O‐xyloside
