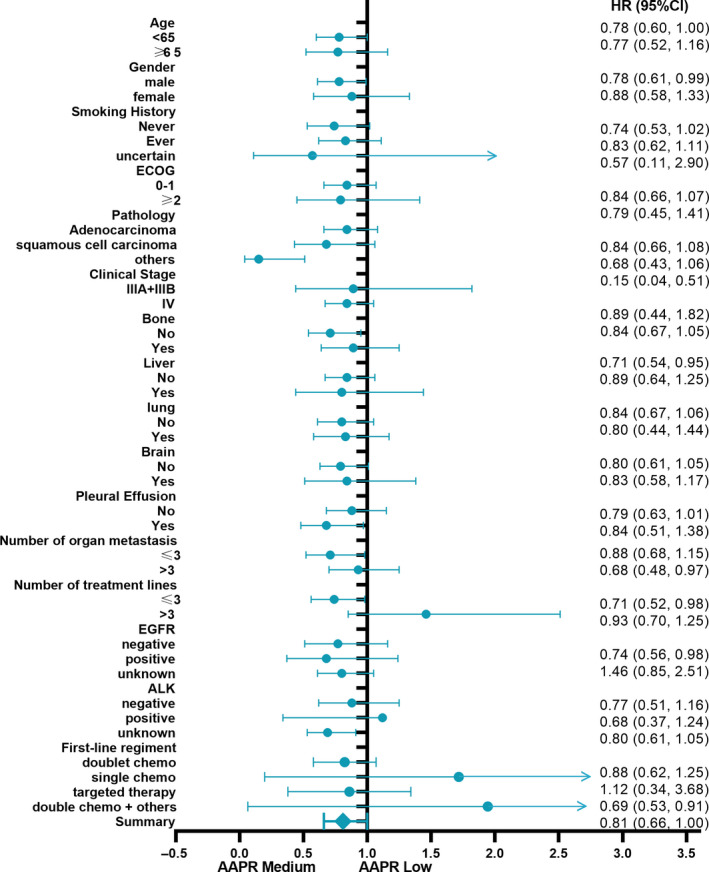
FIGURE 4.

Forest plot for presenting the association between the hazard ratio of overall survival and medium AAPR in advanced NSCLC patients

Forest plot for presenting the association between the hazard ratio of overall survival and medium AAPR in advanced NSCLC patients