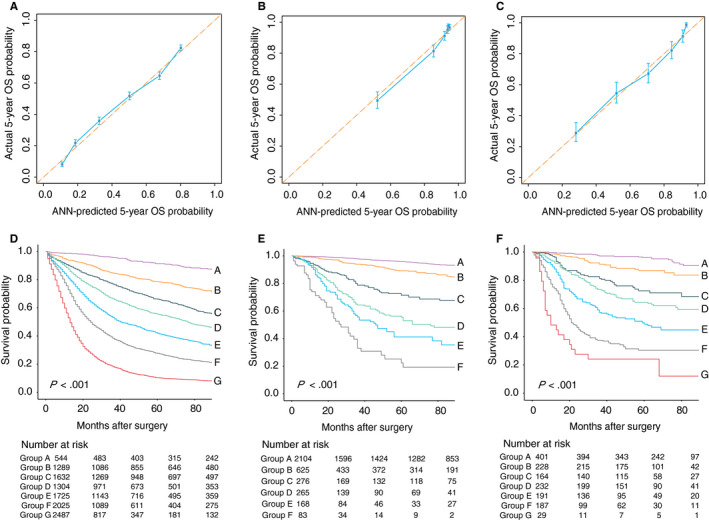
FIGURE 2.

A‐C, Calibration of the ANN model in the SEER, CIAH, and PUCHI cohorts. The x‐axis and y‐axis represents the 5‐year survival probabilities predicted using the ANN model and the actual 5‐year survival rates, with 95% confidential interval, respectively. D‐F, Kaplan‐Meier survival curves of the ANN risk subgroups in the SEER, CIAH, and PUCHI cohorts
