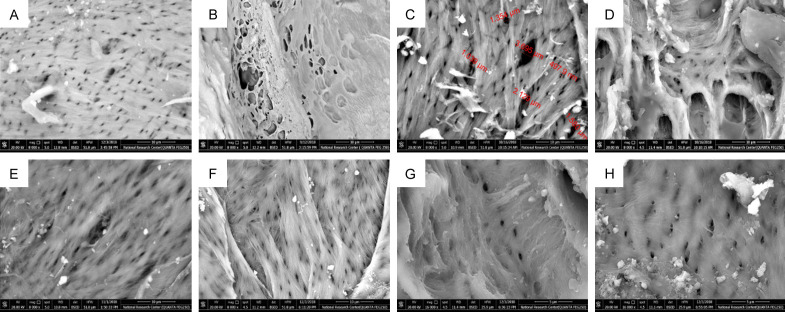
Figure 5.
SEM images. A. NC group showing normal jawbone architecture with equal and uniform porosity. B. OC group showing increased BP, where large and irregular bone pores were observed. C. T group showing measurement of bone pores at week 16 with variation in size of bone pores. D. L group showing BP at week 16 with some bone pores started to get narrower. E. T+L group showing numerous small regular pores with few large ones at week 19. F. T group showing numerous uniform bone pores, G. L group showing uniform regular bone pores at week 24. H. T+L group showing uniform regular bone pores at week 24 with some pores are getting completely obscured.

