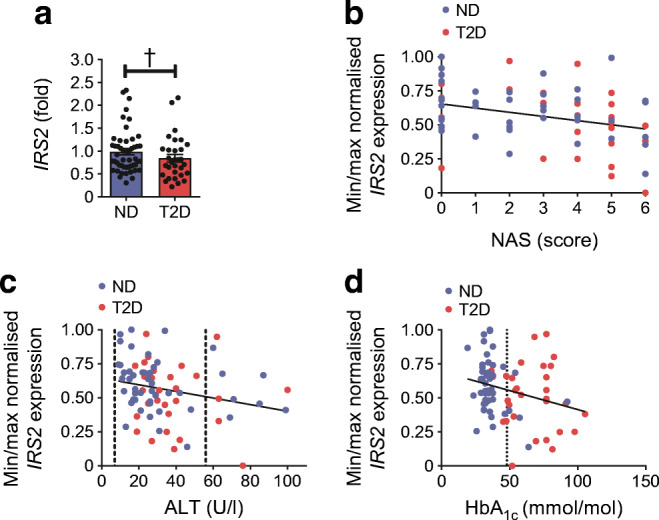
Fig. 1.

The impact of hepatic IRS2 expression on liver health status. (a) Hepatic IRS2 expression is significantly decreased in individuals diagnosed with type 2 diabetes (T2D; n = 31) in comparison with those without type 2 diabetes (ND; n = 50), independently of age, sex or BMI (pa = 0.0417). Gene expression was normalised to the expression of a housekeeper gene and is shown as mean fold ± SEM relative to ND, as calculated by the method. (b, c) IRS2 expression correlates with liver steatosis and fibrosis status (NAS) (b; r = −0.2937, pa = 0.0157; q = 0.0722; n = 68) and with serum concentration of ALT (c; r = −0.2403, pa = 0.0143; q = 0.0722; n = 78). (d) Hepatic IRS2 expression correlates with HbA1c values independently of age, sex and BMI (r = −0.2668, pa = 0.0075; q = 0.0578; n = 68). In (c) and (d), reference values are indicated by dashed lines. Pearson’s correlation or Spearman’s correlation (p) and linear regression analysis (pa) was used to calculate an association between gene expression (ΔCt) and other parameters. For visualisation, gene expression was normalised by minimum (min)/maximum (max) normalisation (1 − (xi − xmin)/(xmax − xmin)), to a scale from 0 (min expression) to 1 (max expression), whereby xi is the current ΔCt value of a specific gene, xmin is the minimum ΔCt value of all measurements of a specific gene and xmax is the maximum ΔCt value of all measurements of a specific gene. Gene expression is shown as normalised expression on the axes. †pa < 0.05
