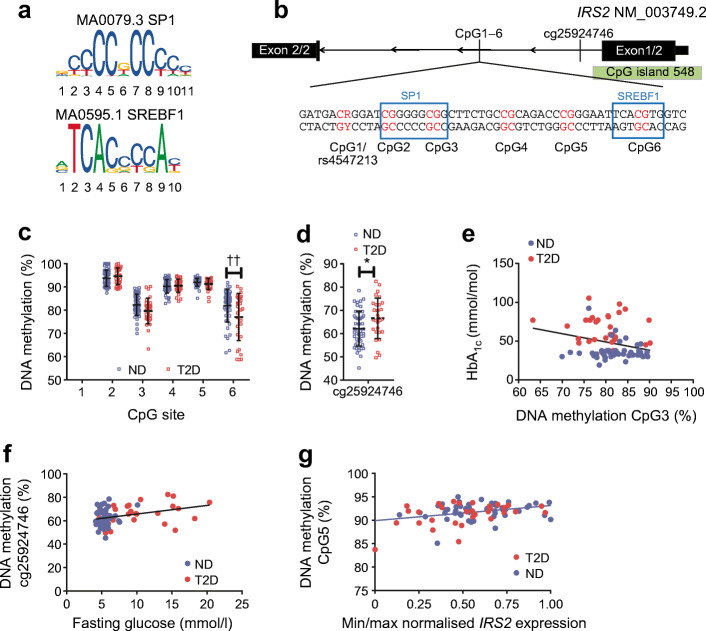
Fig. 2.
DNA-methylation pattern and sequence snippet of intron 1 of IRS2. (a) Transcription-factor binding profiles of SP1 (GC-box) and SREBF1 (E-box) from JASPAR database [14]. (b) An overview of the IRS2 gene (NCBI reference sequence: NM_003749.2) and the location of the seven CpG sites analysed. The promoter-associated CpG island is shown in green. A sequence snippet from IRS2 intron 1, with the location of CpG1–CpG6 within a GC-box (SP1 binding) and E-box (SREBF1 binding) motif, is magnified. (c) The DNA-methylation pattern of CpG2–CpG6 after stratification by diabetes status (non-diabetic [ND], n = 50; type 2 diabetic [T2D], n = 31). CpG6 within the E-box motif shows a difference in DNA methylation of 4.92% between T2D and ND (linear regression analysis: p = 0.0152; pa = 0.0029). Each data point represents one individual; the black horizontal lines indicate the mean ± SD. (d) The graph shows per cent hepatic DNA methylation at cg25924746 (CpG1; affected by rs4547213) in T2D and ND obese participants (ND, n = 44; T2D, n = 28). Methylation was significantly higher in T2D participants (mean difference, 4.83%; p = 0.0208). This finding was sex-dependent and diminished after adjustment for intracohort variability (pa = 0.0771). In (c) and (d), individual data points are shown with the mean (black horizontal line). (e) DNA methylation at CpG3 (GC-box) correlates negatively with HbA1c values (r = −0.2674; pa = 0.0281; q = 0.103; n = 81). (f) DNA methylation at cg25924746 correlates positively with fasting glucose (r = 0.3325, p = 0.0043; n = 72). This finding was sex-dependent and diminished after adjustment for intracohort variability, and was not significant after correction for multiple testing (pa = 0.0600; q = 0.3555). (g) DNA methylation of CpG5 correlates with IRS2 expression in the liver in the entire cohort (r = 0.3415, pa = 0.0025; q = 0.0283; n = 81). Pearson’s correlation (p) and linear regression analysis (pa) were used to calculate the association between DNA methylation and the investigated parameters. Max, maximum; min, minimum. *p < 0.05; ††pa < 0.01

