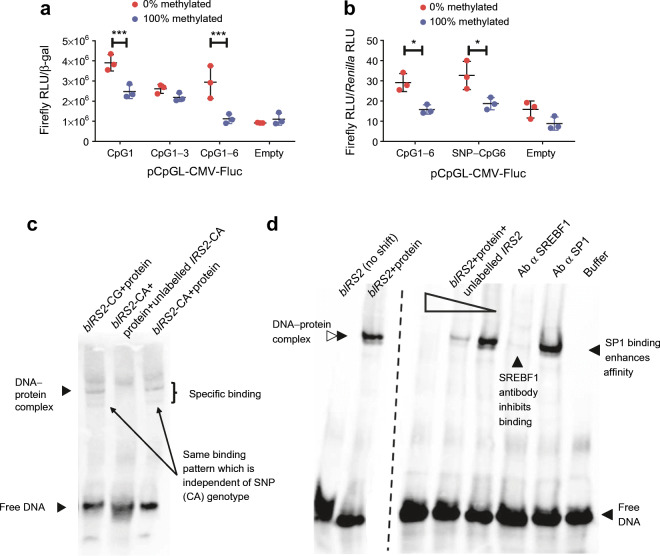
Fig. 3.
Methylation-sensitive luciferase reporter gene assay and EMSA using HepG2 cells to prove mechanistic influence of CpG regions analysed and validation of specific binding of transcription factors. (a) A methylation-sensitive luciferase reporter gene assay shows significant upregulation of the Firefly luciferase gene for unmethylated plasmid DNA (n = 3). These results indicate that methylation solely at CpG1 or CpG1–CpG6 influences the CMV promoter of the Firefly-luciferase-encoding gene. (b) The methylation- and polymorphism-sensitive luciferase reporter gene assay shows no difference between luciferase expression with the SNP rs4547213 genotype (SNP–CpG6), in which CpG1 is deleted, and cells containing the full CpG-site 1 (CpG1–CpG6) or the SNP (SNP–CpG6) (n = 3). (c) Biotinylated DNA (bIRS2) oligonucleotides containing either the CG (lane 1) or CA (lanes 2 and 3) genotypes were incubated with HepG2 nuclear extracts (protein) for EMSA. The EMSA shows a shift of biotinylated DNA–protein complexes, meaning that protein was bound. In lane 2, the reaction was additionally incubated with excess unlabelled DNA (unlabelled IRS2) which competes with the bIRS2 and specifically erases the shift of labelled DNA. There is no observable difference in protein binding nor specificity between CG and CA genotypes (lane 1 and lane 3), therefore, protein binding is not influenced by the polymorphism rs4547213. (d) EMSA shows a shift of bIRS2, containing CpG1–CpG6, after incubation with nuclear extracts of HepG2 cells (bIRS2 + protein, lane 2), which can be erased by incubation with different concentrations of unlabelled IRS2 (12.5 pmol, 1.25 pmol, and 0.125 pmol, as indicated as gradient shape across lanes 3–5). Incubation of the binding reaction with an antibody against SREBF1 (Ab α SREBF1, lane 6) appeared to inhibit SREBF1 binding, reducing the intensity of the DNA–protein complex band, whereas incubation with an antibody against SP1 (Ab α SP1, lane 7) increased SP1 binding and, hence, the intensity of this band. As a control, the nuclear extraction buffer (Buffer, lane 8) shows no background signal. The dotted line indicates omission of three lanes (see ESM Fig. 3 for the unmodified blot). Data are shown as mean ± SEM. β-gal, β-galactosidase; RLU, relative luminescence units. *p < 0.05,***p < 0.001, repeated two-sided Student’s t test

