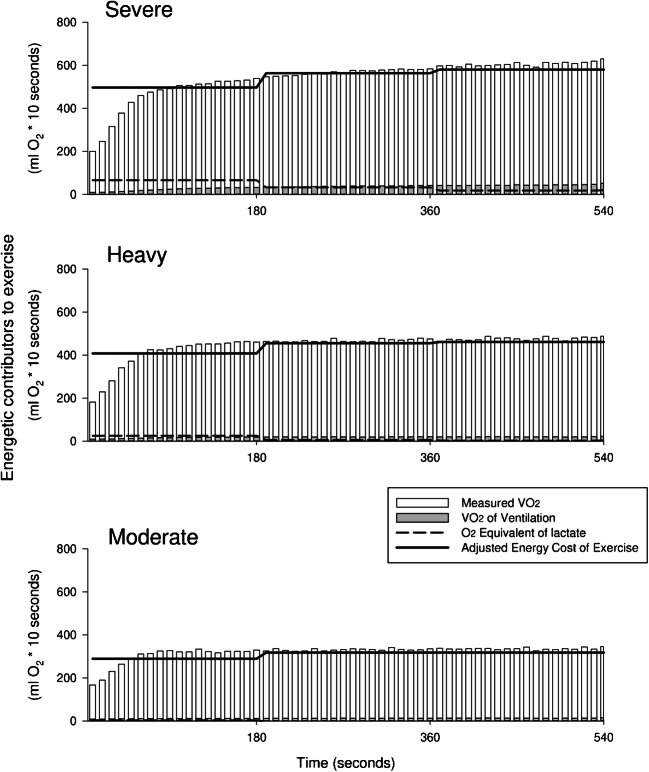
Fig. 2.
An overview of the energetic contributors to exercise is reported in 10-s averages for the “severe” (top panel), “heavy” (medium panel), and “moderate” (bottom panel) exercise intensity domain. White columns represent directly measured VO2. Grey columns indicate the O2 cost requested by ventilation. The black dashed line displays the energy provided by glycolytic sources over 3 min segments. Finally, the black solid line represents the adjusted cost of exercise accounting for both aerobic and glycolytic energy sources. Please note that during all the first 3 min segments, the contribution of immediate energy sources (O2 and phosphocreatine) was not accounted and was probably the cause of the lower adjusted VO2 between the first and the successive time segments [8, 22]

