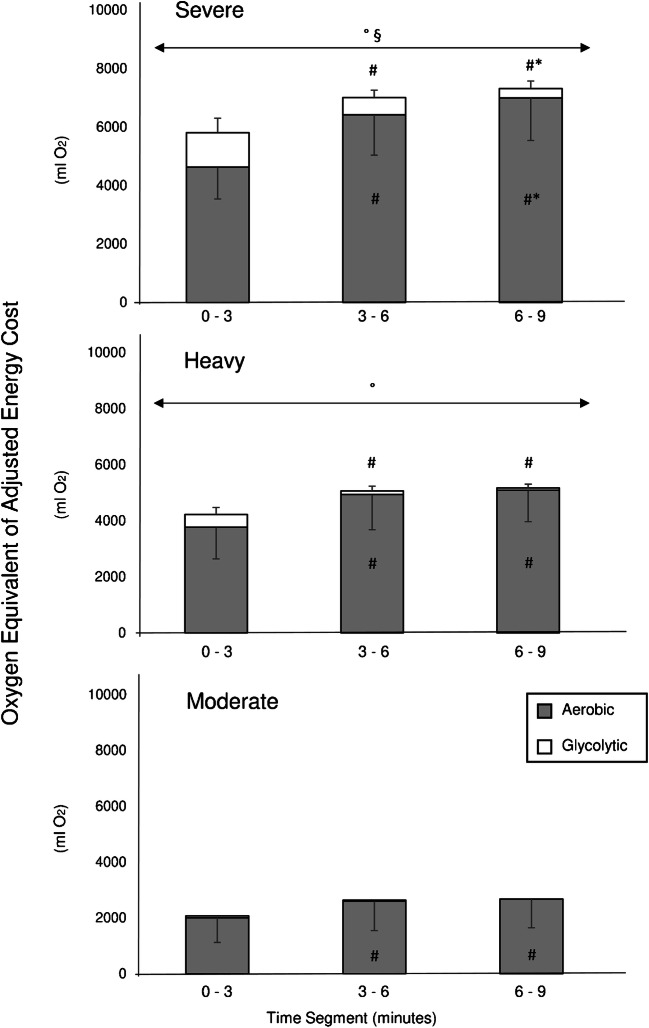
Fig. 3.
Three-min mean oxygen equivalents of aerobic (grey, i.e. VO2 subtracted by VO2VM) and glycolytic (white, i.e. [La−] equivalent) cost of exercise are represented respectively for the “severe” (top panel), “heavy” (medium panel) and “moderate” (bottom panel) exercise intensity domain. ANOVA revealed a significant “intensity” × “time” interaction both for aerobic (p ≤ 0.001, ηp2: 0.81) and anaerobic (p ≤ 0.001, ηp2: 0.58) cost of exercise. Multiple comparisons are displayed as: # significant statistical difference with 0 to 3 min segment; * significant statistical difference with 3 to 6 min segment. ° and § represent respectively statistical difference with the “moderate” and “heavy” exercise intensity domain. Please note that values measured during warm-up were subtracted

