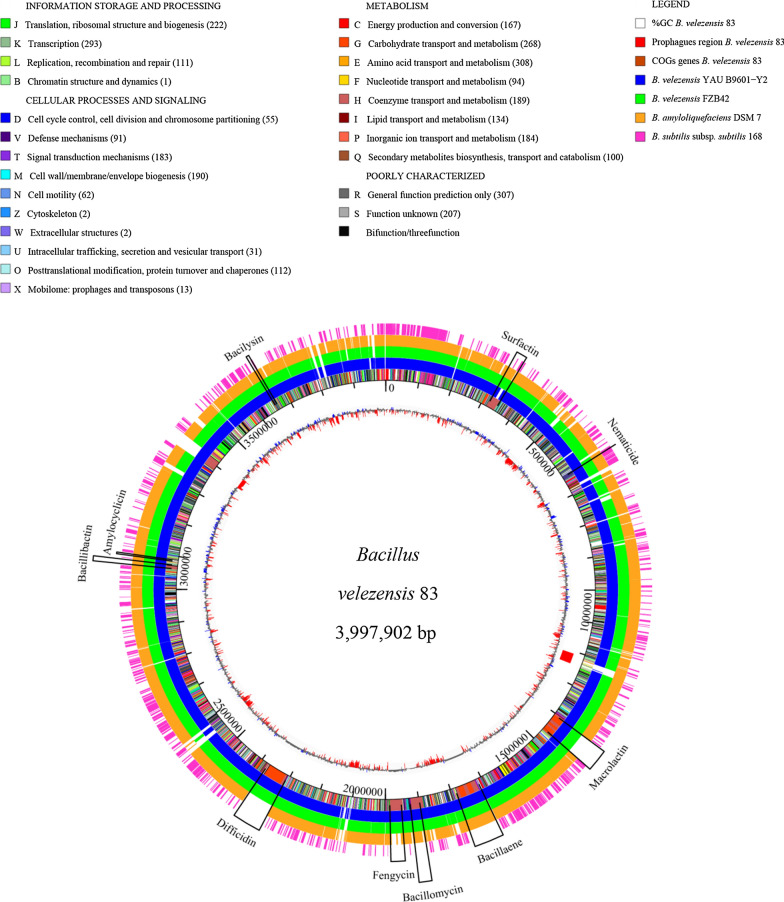
Fig. 4.
Graphical representation of B. velezensis 83 genome. From the innermost circle to the outermost: average GC (%) content profile, prophage region (red), the complete genome of B. velezensis 83. Color bars in the circle indicate the corresponding COG classification showed in the upper part of the scheme, the number of protein identified for each functional class is shown in (parentheses); subsequent circles indicate conserved regions with the genome of B. velezensis YAUB9601-Y2 (blue), B. velezensis FZB42 (green), B amyloliquefaciens DSM7 (orange), Bacillus subsp. subtilis (purple). The distribution of metabolite gene clusters is indicated by black rectangles and the cluster name

