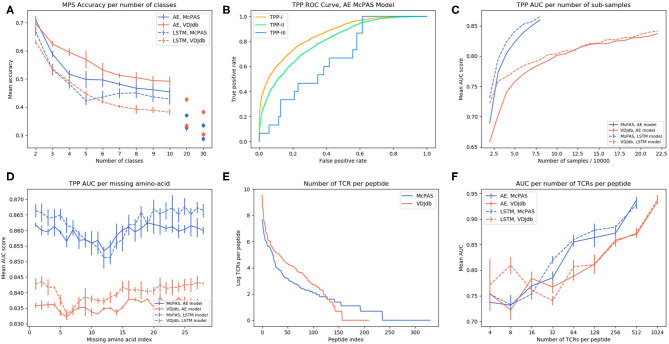
Figure 2.
(A) AE and LSTM models MPS accuracy per number of peptide classes in McPAS-TCR (23) and VDJdb (27) datasets. (B) ROC curve of TPP-I, II, and III AE model performance on McPAS dataset. (C) AUC for TPP-I as a function of the sub-sample size. (D) AUC of TPP-I per missing amino-acids index. (E) Number of TCRs per peptide distribution in McPAS-TCR and VDJdb datasets, logarithmic scale. (F) AUC of TPP-I per number of TCRs per peptide bins (bins are the union of all TCRs that match peptides with total number of TCRs in a specific range).

