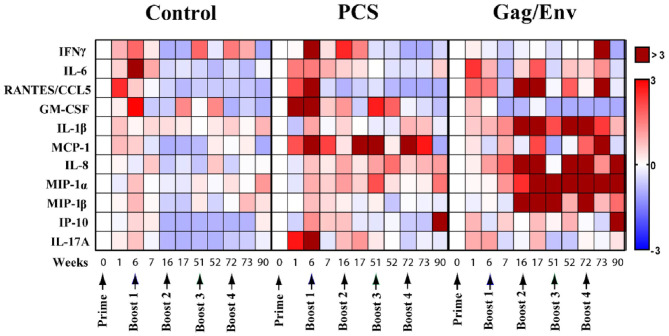
Figure 2.
Median cytokine/chemokine fold-change levels at each time point relative to group baseline (Week 0) in all 3 vaccine groups. The fold change was calculated as the ratio of the concentration to the baseline where baseline was set to 0. Arrows indicate each immunization. Bar = Fold change, Shades of blue = downregulated, Shades of red = upregulated. n = 8 monkeys/group (n = 7 for Gag/Env). Experiments were run in duplicates.

