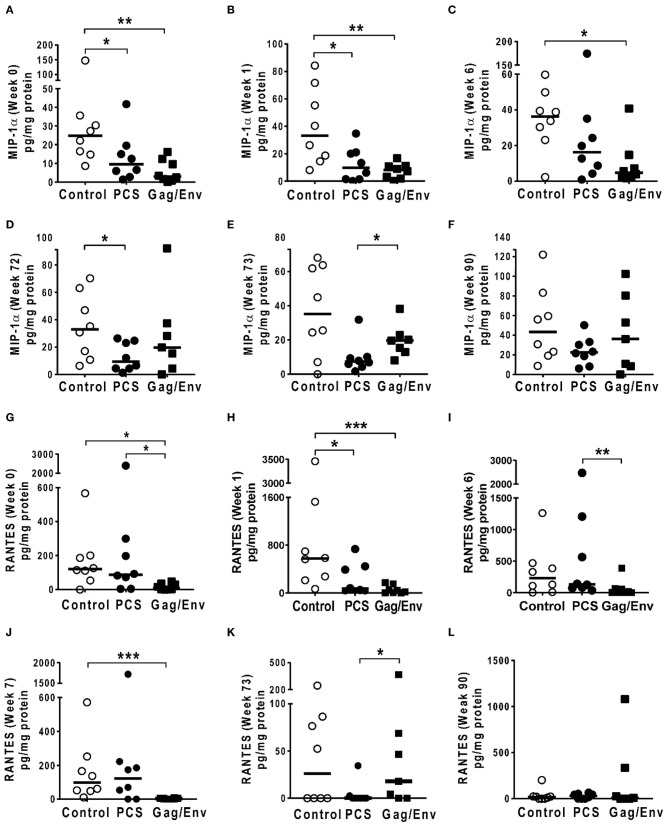
Figure 8.
Significant differences in CVL levels of MIP-1α, and RANTES among the 3 vaccine groups at different time points including Week 0 and 90 analyzed using Mann-Whitney t-test. Data presented as values from individual monkeys with median. (A–F) MIP-1α (G–L) RANTES. n = 8 monkeys/group (n = 7 for Gag/Env). Experiments were run in duplicates. *P < 0.05, **P < 0.01, and ***P < 0.001. Non-significant differences between groups were not included.

