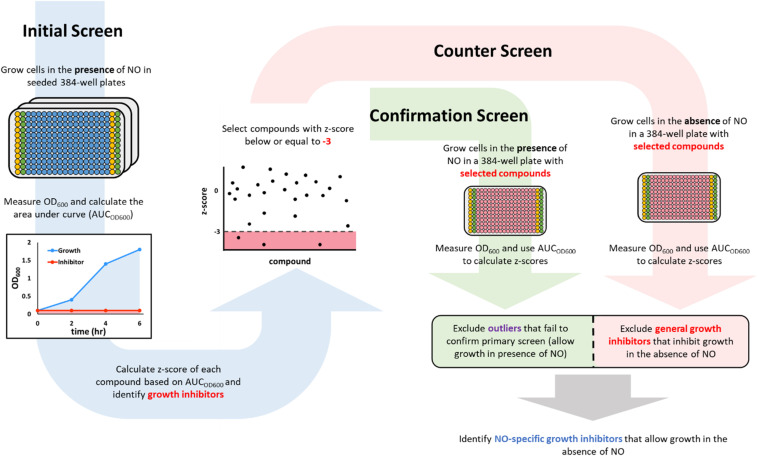
FIGURE 1.
A schematic description of the screening workflow. In the initial screen (blue arrow on the left), 384-well plates were seeded with compounds (blue wells) from a chemical library in the Princeton University Small Molecule Screening Center. The columns on the edges were used to run positive (yellow wells that contained 100 μM KCN) and negative (green wells that contained DMSO). After the addition of cells and DPTA, growth in each well was monitored by measuring OD600, which was used to calculate an area under the curve (AUCOD600). Compounds that inhibited growth in the presence of NO would have a low AUCOD600 (red shaded area), whereas those that allowed growth would yield a high AUCOD600 (blue shaded area). Inhibitors from the initial screen (those with a z-score < –3) were then passed on to a confirmation screen (green arrow in the middle), in which growth inhibition in the presence of NO was verified, and a counter screen (red arrow on the right), in which growth in the absence of NO was measured. Compounds that failed the confirmation test (green square) or were growth inhibitory in the absence of NO (red square) were discarded. The remaining compounds were identified as NO-dependent growth inhibitors because they allowed growth in the absence of NO, but inhibited growth in the presence of NO at a concentration that could not inhibit growth on its own.

