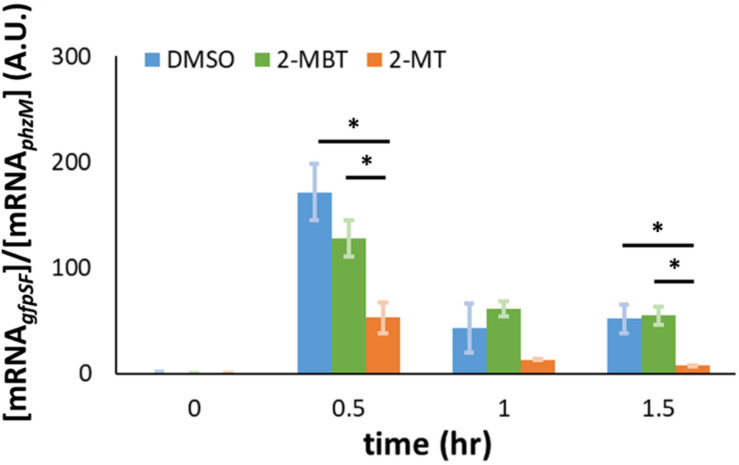
FIGURE 10.
Abundance of gfpSF mRNA in the presence of NO. gfpSF was expressed from the native hmp promoter (Phmp) on pUA66. At time = 0, DPTA was added to achieve a final concentration of 250 μM in bioreactors containing different compounds. At time points, samples were withdrawn from the bioreactors, and the abundance of mRNAgfpSF in those samples was measured by qPCR. Here, [mRNAgfpSF] is normalized by [mRNAphzM] to account for losses during purification. The solid bars represent the means of at least 3 independent experiments, and the error bars the standard errors of those means. Statistical significance, indicated by the asterisk signs (*), was determined by first running a one-way ANOVA test across all treatment conditions at the same time point. When the p-value from the ANOVA test was lower than 0.05, difference between groups were assessed by performing Tukey’s test, with a p-value threshold of 0.05.

