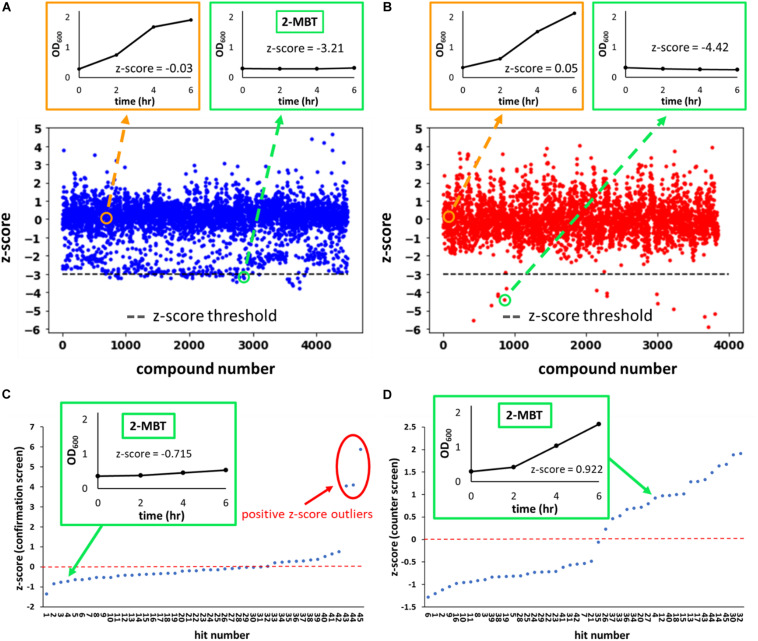
FIGURE 2.
z-score from the initial, confirmation and counter screens. In (A,B), the z-scores of every compound evaluated during the initial screen are plotted. Compounds were from two sub-libraries: one containing compounds with demonstrated biological activity (biologically active library) (A) and the other representing a general small molecule library (generic library) (B). A total of 8,320 compounds were tested in the initial screen, 4,480 of which came from the biologically active library and the remaining 3,840 from the generic library. Representative OD600 profiles that either passed (outlined in green) or did not pass (outlined in orange) the z-score threshold of –3 (horizontal gray line) were plotted on the top. The growth curve associated with 2-MBT treatment from the initial screen is plotted in the green box in (A). In (C,D), the z-scores of hits from the initial screen during the confirmation and counter screens are plotted. In (C), growth inhibition in the presence of NO was verified. Compounds with high z-scores allowed growth and were identified as outliers (circle in red). We note that since the confirmation screen only included hits, the z-scores between the primary screen and confirmation screen will not be the same. In (D), growth in the absence of NO was measured. NO-specific growth inhibitors would not inhibit growth during this screen, so compounds with the higher z-scores allowed relatively better growth. A natural break in the data occurs around a z-score of 0 in the counter screen, therefore compounds with z-scores > 0 were identified as growth permissive. Of note, out of 20 compounds that had a positive z-score in the counter screen, 3 were outliers in the confirmation screen (C) and thus were disqualified, and 17 compounds were identified as hits from the screening procedure.

