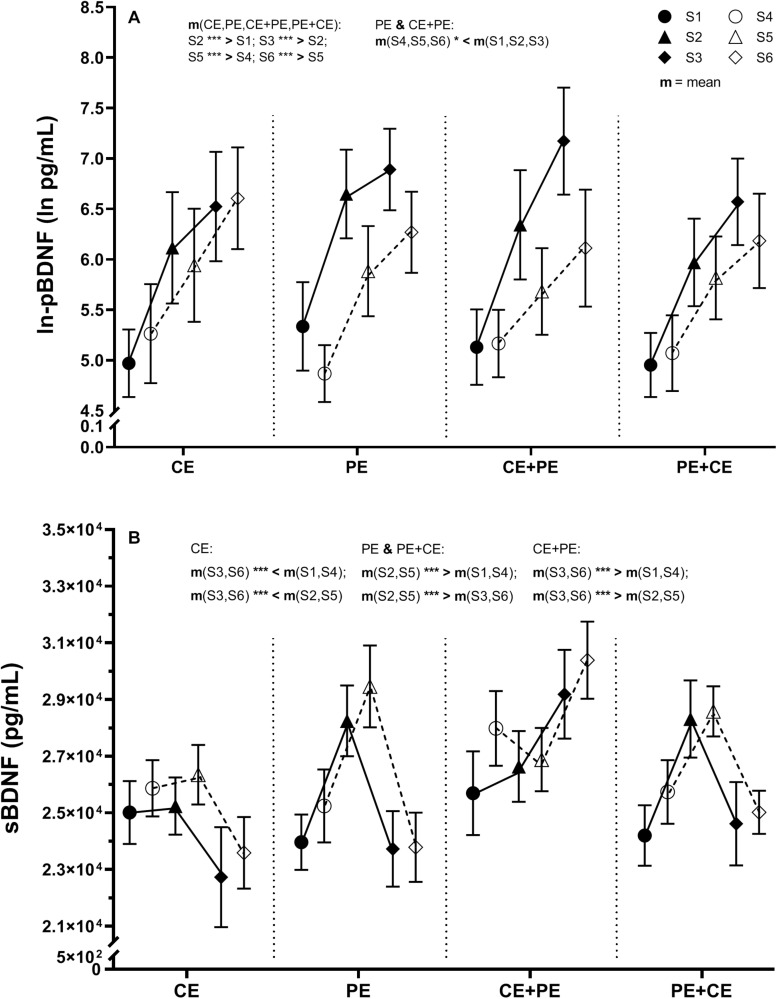
FIGURE 3.
Descriptive data and results from the statistical analysis of (A) natural-log transformed plasma BDNF (ln-pBDNF) and (B) serum BDNF (sBDNF) response to cognitive and physical exercise. BDNF concentrations were measured in blood samples drawn immediately after 15 min of rest (S1 and S4 at pretest and posttest, respectively), immediately after the first exercise (S2 and S5 at pretest and posttest, respectively) and immediately after the second exercise or rest (S3 and S6 at pretest and posttest, respectively). The investigated groups performed either cognitive exercise only, followed by rest (CE), physical exercise only followed by rest (PE), cognitive followed by physical exercise (CE + PE) or physical followed by cognitive exercise (PE + CE). For ln-pBDNF, values are presented as natural-log means ± 95% CI and for sBDNF as means ± SE. Graphs also display the results from mixed model ANOVA analysis of ln-pBDNF for the significant interaction “prepost × group” and interaction “prepost × time,” and of sBDNF for the significant interaction “time × group.” m, mean; *p < 0.05; ***p < 0.001. The level of significance was set at p < 0.05.

