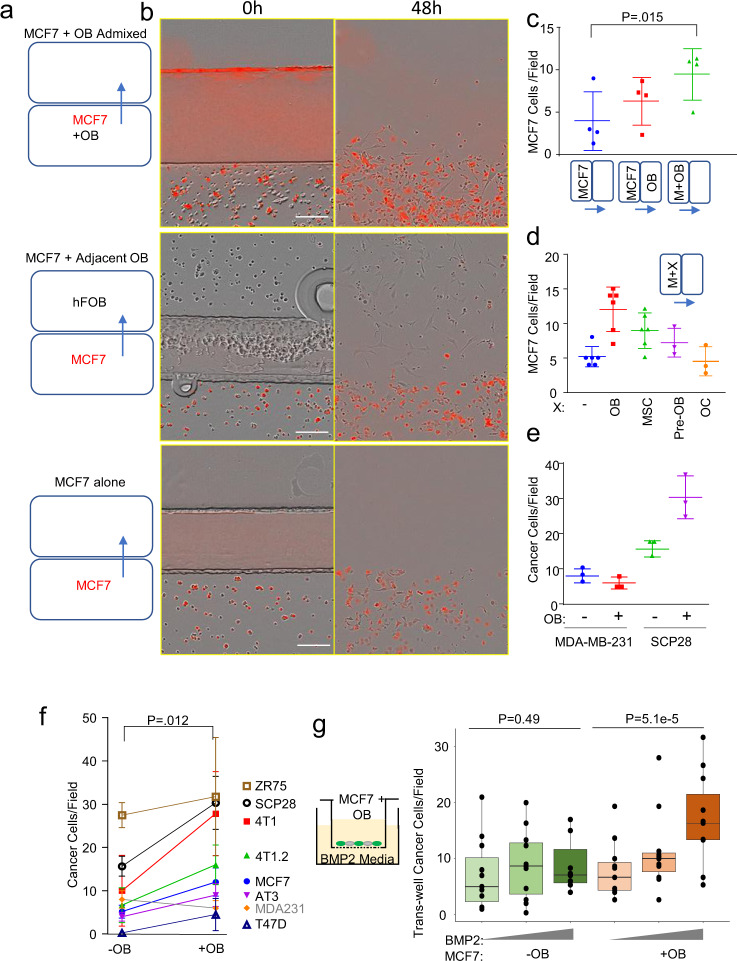
Fig. 1. Breast cancer cells which express E-cadherin have increased migration when cultured with osteogenic cells in vitro.
a Ibidi silicone removable chambers were used to quantify migration by breast cancer cells in monoculture, in co-culture with osteoblasts in adjacent chambers, or in direct admixture in the same chamber. b To distinguish cell types, fluorescently labeled breast cancer cells were co-cultured with unlabeled osteoblasts (OBs), and imaged with the Incucyte S3. Scale bar is 100 µm. c Dot plot showing the number of cells escaped from their original enclosure per field for MCF-7 alone, in co-culture with OBs in adjacent regions, or in co-culture with osteoblasts in the same region after 48 h. P-value determined by students t-test (two-tailed). Each dot represents a biological replicate, an average of three technical replicates. d Dot plot shows the number of cells escaped per field for MCF-7 alone, and in co-culture with OBs (represented by hFOB1.19 cells), pre-osteoblasts (Pre-OB represented by MC3T3-E1 cells), human mesenchymal stem cells (MSCs), and osteoclasts (OC RANK-L differentiated Raw 264.7 cells) after 48 h. Each dot represents a technical replicate. d Dot plot shows the number of cells escaped per field for mesenchymal MDA-MB-231 alone and with osteoblasts, as well as MDA-MB-231 E-cadherin expressing subline SCP-28 alone and with osteoblasts after 48 h. Each dot represents a technical replicate. e Dot plot shows the combined data for cells escaped per field for various E-cadherin expressing breast cancer cell lines alone and with osteoblasts. For contrast MDA-MB-231, which lacks E-cadherin expression, is also shown (not included in statistical comparison). P-value determined by students paired t-test (two-tailed). Each dot represents a biological replicate, an average of at least three technical replicates. f Box plot shows the transwell migration (a diagram shown in the left) of MCF-7 cells toward a gradient (0, 1, and 5 µM) of Bone Morphogenetic Protein-2 (BMP-2) with or without admixture of OBs. Each dot represents a biological replicate generated from an independent experiment average of three technical replicates. For c–f error bars indicate standard deviation. (For g), the lower and upper hinges correspond to the first and third quartiles (the 25th and 75th percentiles). The upper whisker extends from the hinge to the largest value no further than 1.5 × IQR from the hinge. The lower whisker extends from the hinge to the smallest value at most 1.5 × IQR of the hinge. Data beyond the end of the whiskers are called “outlying” points and are plotted individually. P-value as determined by analysis of covariance (ANCOVA) as elaborated in “Methods”.

