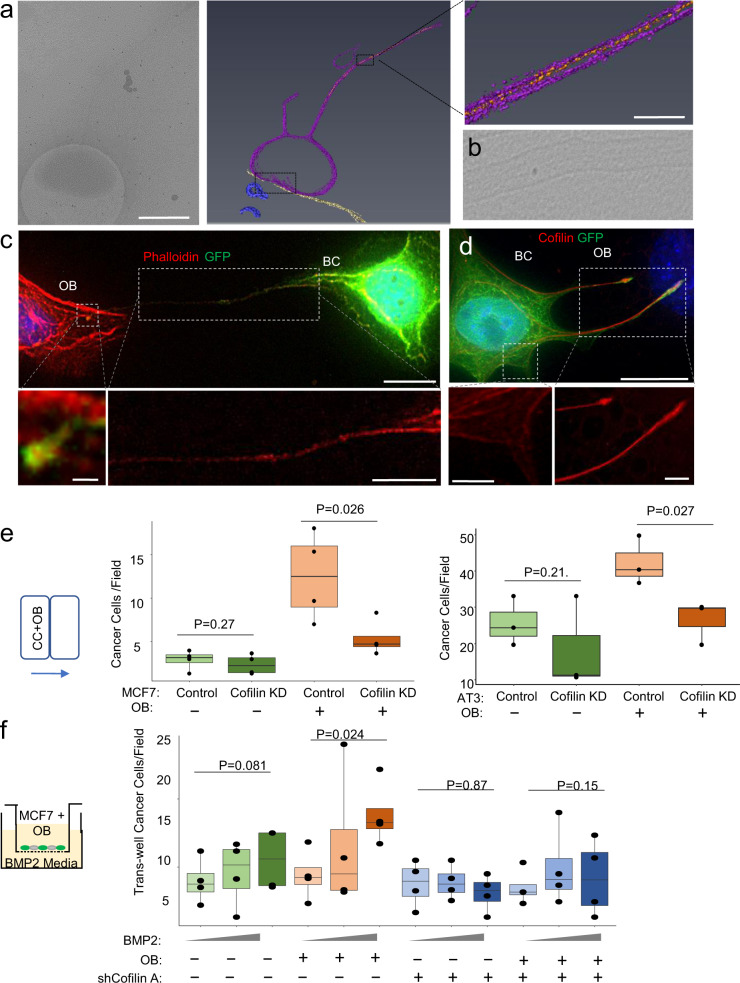
Fig. 3. Protrusions are driven by actin, cofilin, adhere to OBs using E-Cadherin.
a Cryo-ET tomogram showing actin fibers (orange) within the stalk of MCF-7 DSLS (purple) contacting an osteoblast (yellow). Scale bars are 500, 50 nm, respectively. b Micrograph from an additional MCF-7 DSLS showing actin fibers. c Phalloidin staining shows actin filaments in the DSLS stalk. Scale bars are 15 (upper), 1 (lower left), and 10 µm (lower right) respectively. d Cofilin immunolabeling of DSLS. The red channel intensity is matched for both the zoom of DSLS and of the cell body, normal filopodia to emphasize cofilin distribution. Scale bars are 15 (upper), 5 (lower left), and 5 µm (lower right), respectively. e Box and dot plots showing the cells per field migrated out of the chamber for MCF-7 and AT3 cells transfected with GIPZ shRNA construct Empty Vector (Control), and a shRNA against cofilin for knockdown (Cofilin KD), with and without OBs. Each dot represents a biological replicate, an average of three technical replicates. f Box plot showing the transwell migration cells through the membrane per field for MCF-7 transfected with GIPZ shRNA construct Empty Vector, and the shRNA against cofilin (Cofilin KD) with and without OBs. Each dot represents a biological replicate, an average of three technical replicates. For box plots, the lower and upper hinges correspond to the first and third quartiles (the 25th and 75th percentiles). The upper whisker extends from the hinge to the largest value no further than 1.5 × IQR from the hinge. The lower whisker extends from the hinge to the smallest value at most 1.5 × IQR of the hinge. Data beyond the end of the whiskers are called “outlying” points and are plotted individually. P-value as determined by either ANOVA (e) or ANCOVA (f) as elaborated in Methods.

