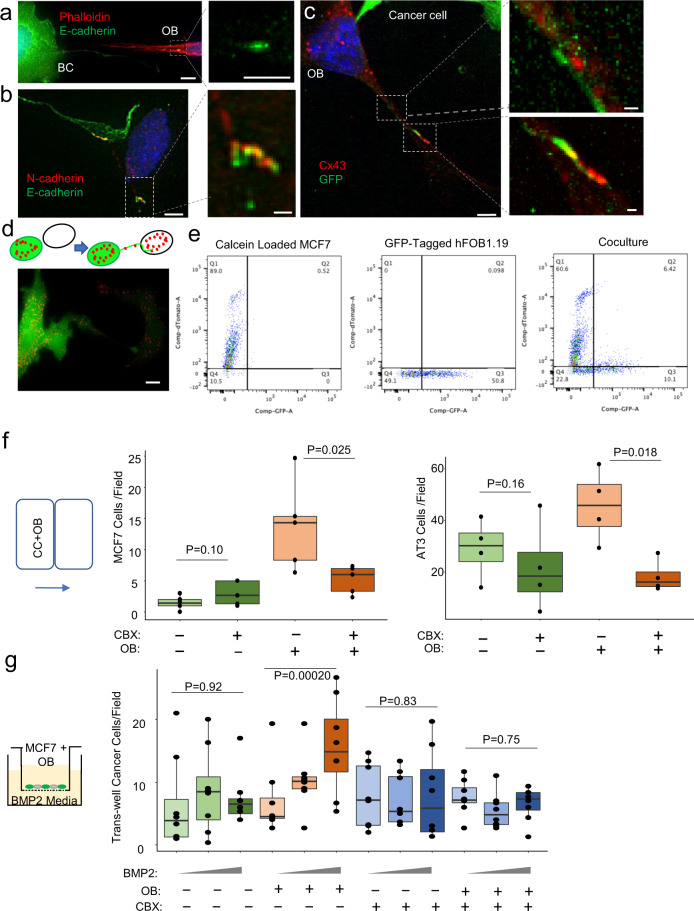
Fig. 4. Protrusions facilitate gap junctions, calcium transfer between the cells.
a MCF-7 E-cadherin (green) expressed where DSLS contacts osteoblast, here visible with phalloidin staining (red). Scale bars are 10 (left), and 5 µm (right), respectively. b MCF-7 E-cadherin (green) binding osteoblast N-cadherin (red) where DSLS contacts osteoblast. Scale bars are 5 (left), 1 µm (right), respectively. c Osteoblast gap junction protein connexin 43 (Cx43 – red) at the site of MCF-7 (green) DSLS contact. Scale bars are 5 (left), 1 (upper right), and 1 µm (lower right), respectively. d Gap junction permeable dye calcein red traversing from MCF-7 to osteoblast via DSLS. Scale bar is 15 µm. e Flow cytometry quantification of calcein dye transfer. The first panel shows un-transfected MCF-7 loaded with calcein red dye. The second shows GFP-labeled osteoblasts. The third shows the co-culture of the two cells after 18 h. f Box plots showing the 2D migration cells through the membrane per field for MCF-7 and AT3 cells treated with 10 µM CBX gap junction inhibitor with and without osteoblasts. Each dot represents a biological replicate, an average of three technical replicates. g Box plots showing the transwell migration cells through the membrane per field for MCF-7 cells treated with 10 µM CBX gap junction inhibitor with and without osteoblasts. Each dot represents a biological replicate, an average of three technical replicates. For box plots, the lower and upper hinges correspond to the first and third quartiles (the 25th and 75th percentiles). The upper whisker extends from the hinge to the largest value no further than 1.5 × IQR from the hinge. The lower whisker extends from the hinge to the smallest value at most 1.5 × IQR of the hinge. Data beyond the end of the whiskers are called “outlying” points and are plotted individually. P-value as determined by either ANOVA (f) or ANCOVA (g) as elaborated in “Methods”.

