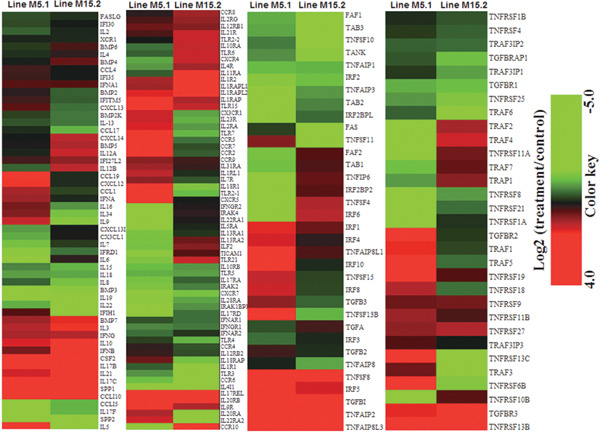
Fig. 2.

Hierarchical clusters of 183 innate immune genes responsive to E. maxima and C. perfringens coinfection in the intestinal mucosa of two chicken lines were based on Euclidean distance correlation analyses. The genes included here showed significant differences in gene expression (p<0.01, log2 fold change compared treatment to control). The genes shown in red were upregulated and those in green were downregulated.
