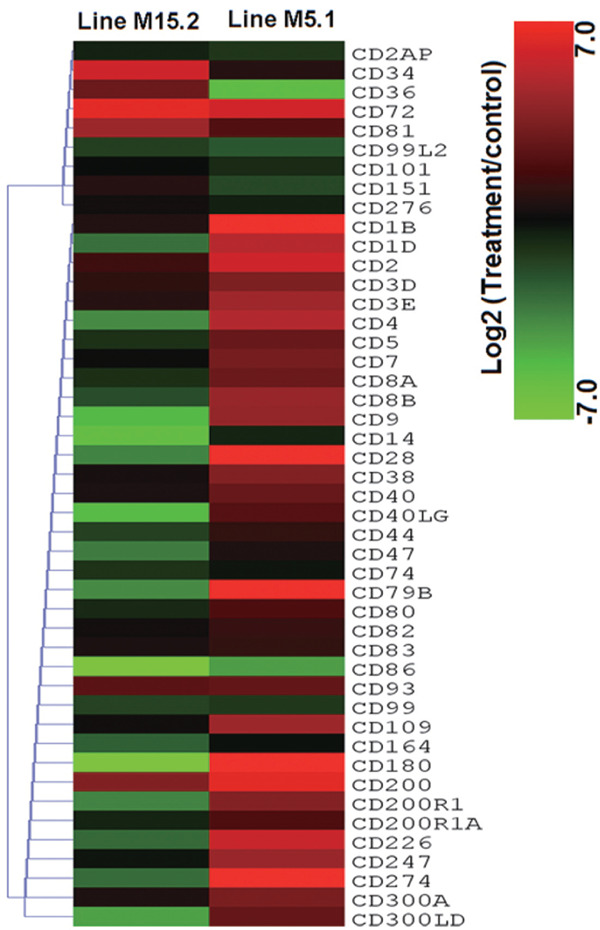
Fig. 4.

Expression of 46 CD marker genes in NE induced chicken lines. The heatmap was generated from a hierarchical analysis of the 46 CD marker genes that showed significant changes in the NE induced chicken lines. The genes included here showed significant differences in gene expression (p<0.01, log2 fold change compared treatment to control) in at least one experiment. The genes shown in red were upregulated expression and those in green were downregulated in the two NE-induced chicken lines.
