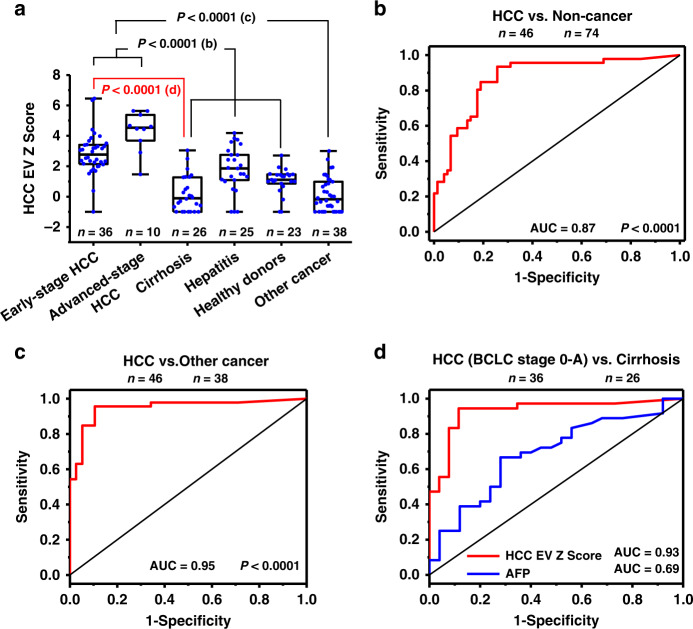
Fig. 5. Statistical analysis on HCC EV Z Scores in different cohorts.
a Box plots representing the HCC EV Z Scores for different patient cohorts including early-stages HCC (n = 36), advanced-stage HCC (n = 10), cirrhosis (n = 26), hepatitis (n = 25), healthy donors (n = 23), and other cancers (n = 38). Whiskers ranging from minima to maxima, median and 25–75% IQR shown by box plots. Significant differences between different groups were evaluated using one-way ANOVA. b, c ROC curves for HCC EV Z Scores in b HCC versus noncancer (i.e., cirrhosis, hepatitis, and healthy donors) (AUC = 0.87, P = 9.64E-12, 95% CI, 0.80–0.94), c HCC versus other cancer (AUC = 0.95, P = 1.79E-12, 95% CI, 0.90–1.00). d ROC curves comparing HCC EV Z Scores (AUC = 0.93, P = 1.02E-8, 95% CI, 0.86–1.00) with the serum biomarker alpha-fetoprotein (AFP) level (AUC = 0.69, P = 0.013, 95% CI, 0.55–0.83) for differentiating early-stage HCC (BCLC, stage 0-A) vs. at-risk cirrhosis. Barcelona Clinic Liver Cancer (BCLC); ROC receiver operator characteristic.

