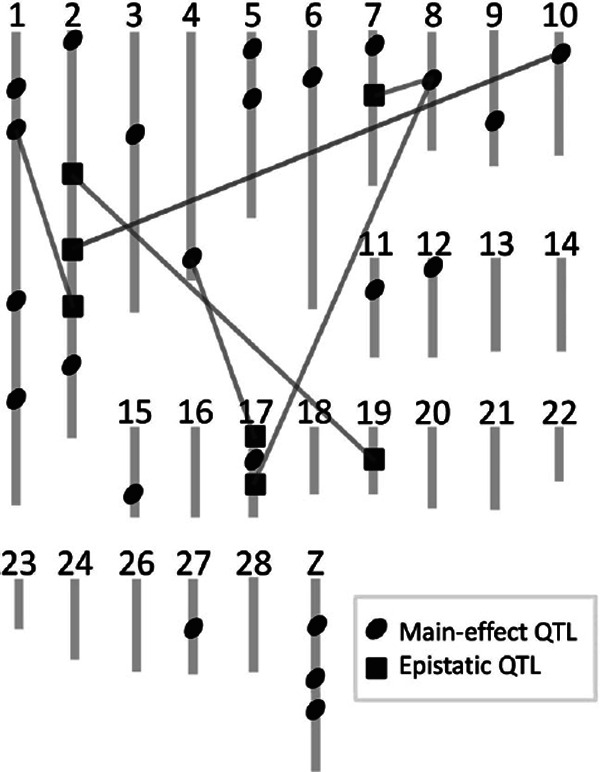
Fig. 4.

Genetic network influencing phenotypic variation of egg-related traits found in the QTL studies with a single resource population. QTLs detected in our previous studies (Goto et al., 2011; 2014a; 2014b) are summarized in this figure. Detailed information including QTL position, flanking markers, and mode of inheritance is summarized in Table 1. Light gray vertical lines numbered 1–24, 26–28, and Z (above) indicate chromosomes. Dark gray ellipses and squares indicate QTL regions with main and epistatic effects on egg-related traits, respectively. Light gray lines between loci indicate epistatic interactions. Based on this figure, at least 30 QTL regions on 17 different chromosomes control phenotypic variation of egg-related traits, which clearly indicates a complex genetic basis of quantitative traits.
