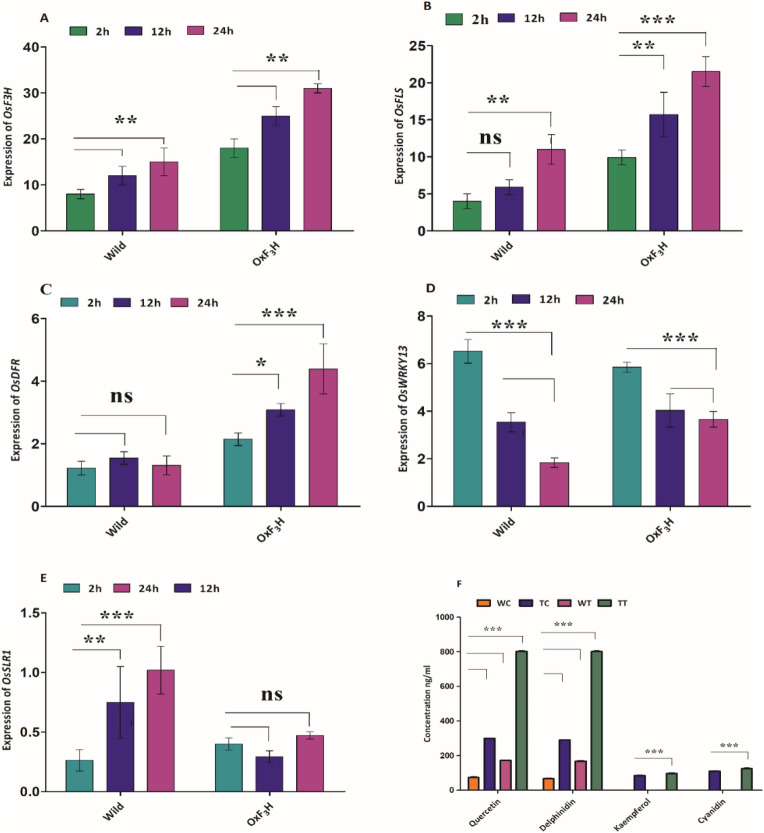
Figure 2.
Expression characteristics of OsF3H and related genes, and LCMS–MS analysis of flavonol and anthocyanin profiling in response to WBPH stress. Bars represent mean ± standard deviation, asterisks indicate significant difference (p ˂ 0.05 two-way ANOVA, Bonferroni post-test) and ns indicate non-significant between wild and transgenic lines. 2 h, 12 h and 24 h represent data taking time points in hours while OxF3H indicate transgenic line. (A) Expression level of OsF3H gene in transgenic line compare to wild type after WBPH infestation. (B–E) Effect of WBPH induced stress on expression of OsFLS, OsDFR, OsWRKY13 and OsSLR1 genes respectively in transgenic plants as compare to wild type. (F) LCMS–MS profiling of flavonol (kaempferol, quercetin) and anthocyanin (delphinidin, cyanidin). WC, TC, WT and TT indicate wild control, transgenic control, wild treated and transgenic treated with WBPH respectively. Kaempferol and cyanidin in wild control and wild treated plants.

