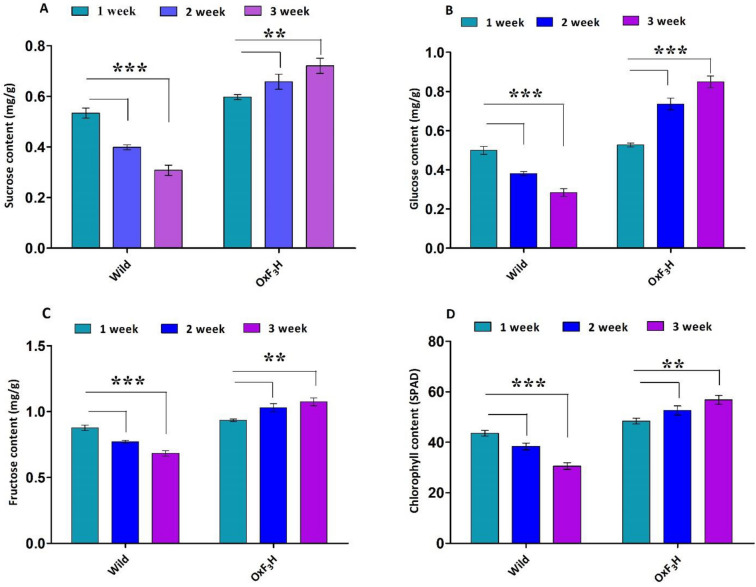
Figure 6.
Sugar contents, chlorophyll contents and JA quantification. Bars represent mean ± standard deviation, asterisks indicate significant difference (p ˂ 0.05 two-way ANOVA, Bonferroni post-test) and ns indicate non-significant between wild and transgenic lines. 1 week, 2 week and 3 weeks represent data taking time points in transgenic as well as wild type plants. (A–C) Sucrose, glucose and fructose quantification respectively under WBPH stress. (D) Chlorophyll contents accumulated after each week of WBPH infestation by SPAD.

