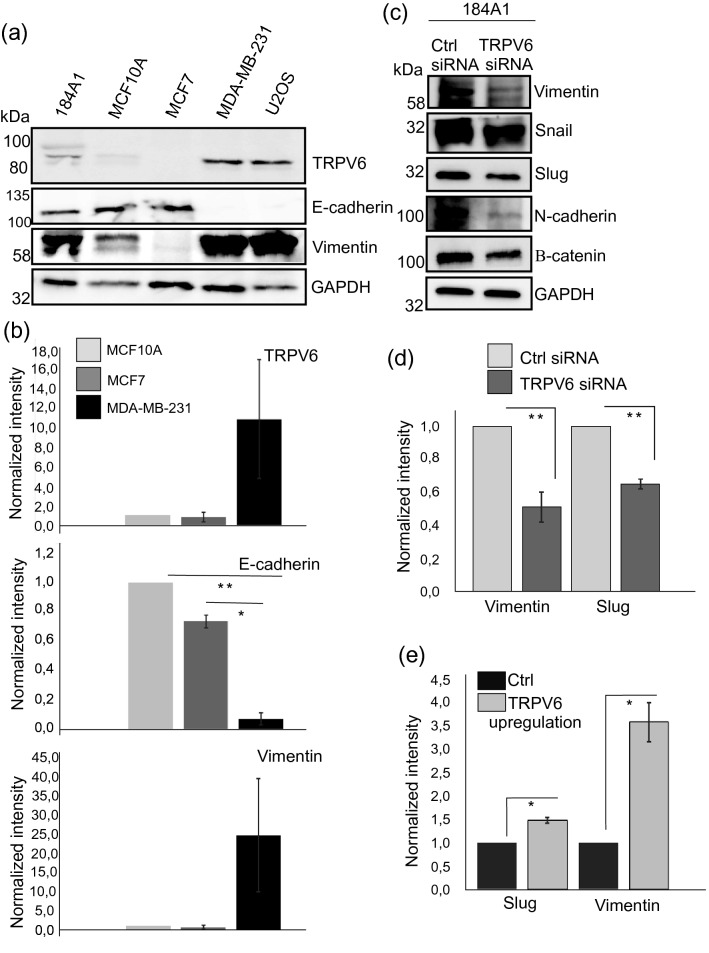
Figure 4.
TRPV6 controls levels of EMT-associated factors. (a) Expression of TRPV6 in different cell lines was analyzed by Western blotting from cellular lysates, with specific antibodies. E-cadherin and vimentin were used to assess epithelial/mesenchymal-like phenotype of the cells and GAPDH was used as a loading ctrl. Weight markers (kDa) for the indicated proteins are shown next to the blots. See also Supplementary Fig. 7a for uncut blots. (b) Quantifications of the protein levels, related to (a). Levels of TRPV6, E-cadherin and vimentin were assessed from the Western blot experiments of MCF10A, MCF7 and MDA-MB-231 cell lines. Both normal mammary epithelial cells and non-invasive MCF7 mammary epithelial cells displayed low TRPV6 expression together with low vimentin and high E-cadherin expression, while invasive MDA-MB231 cells displayed totally opposite expression pattern. Mean (± SEM) is shown. n = 3. *P < 0.05; **P < 0.01 (Paired t-test). Note that although MDA-MB-231 cells displayed much higher levels of TRPV6 and vimentin, due to the variation in between individual Western blot experiments, the statistical difference in between MDA-MB-231 cells and MCF10A or MCF7 cells was not significant (Paired t-test). (c) Western blotting was applied to analyze the expression of EMT-associated proteins from ctrl and TRPV6-depleted 184A1 cells. Specific antibodies against vimentin, snail, slug, N-cadherin and β-catenin were utilized. GAPDH acts as a loading control. Weight markers (kDa) for the indicated proteins are shown next to the blots. See also Supplementary Fig. 7b,c for uncut blots. (d) Quantification of vimentin and slug levels, related to (c). Intensity values were measured in ImageJ and intensity values for vimentin and slug were divided with the corresponding GAPDH values. Control sample values were normalized to 1. Mean (± SEM) is shown. n = 3. *P < 0.05 (Paired t-test). (e) Quantification of vimentin and slug levels upon TRPV6 overexpression, related to Supplementary Fig. S7d. Intensity values were measured in ImageJ and intensity values for vimentin and slug were divided with the corresponding GAPDH values. Control sample values were normalized to 1. Mean (± SEM) is shown. n = 3. *P < 0.05 (Paired t-test).

