Figure 2.

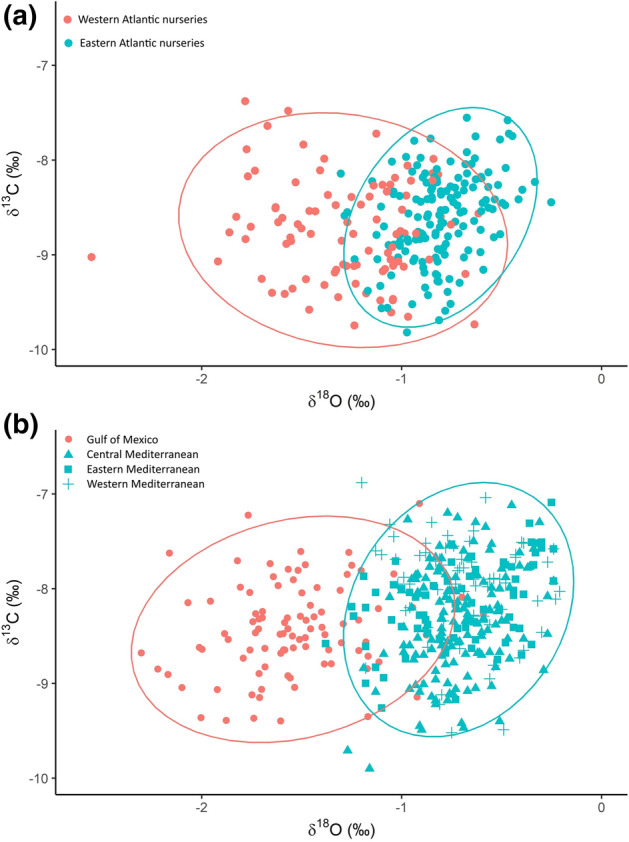
Otolith core values of δ13C and δ18O for the yearling baseline samples used by Rooker et al.29 (a) and for the adult baseline samples used in this analysis (b). 95% confidence ellipses are shown for each population.

Otolith core values of δ13C and δ18O for the yearling baseline samples used by Rooker et al.29 (a) and for the adult baseline samples used in this analysis (b). 95% confidence ellipses are shown for each population.