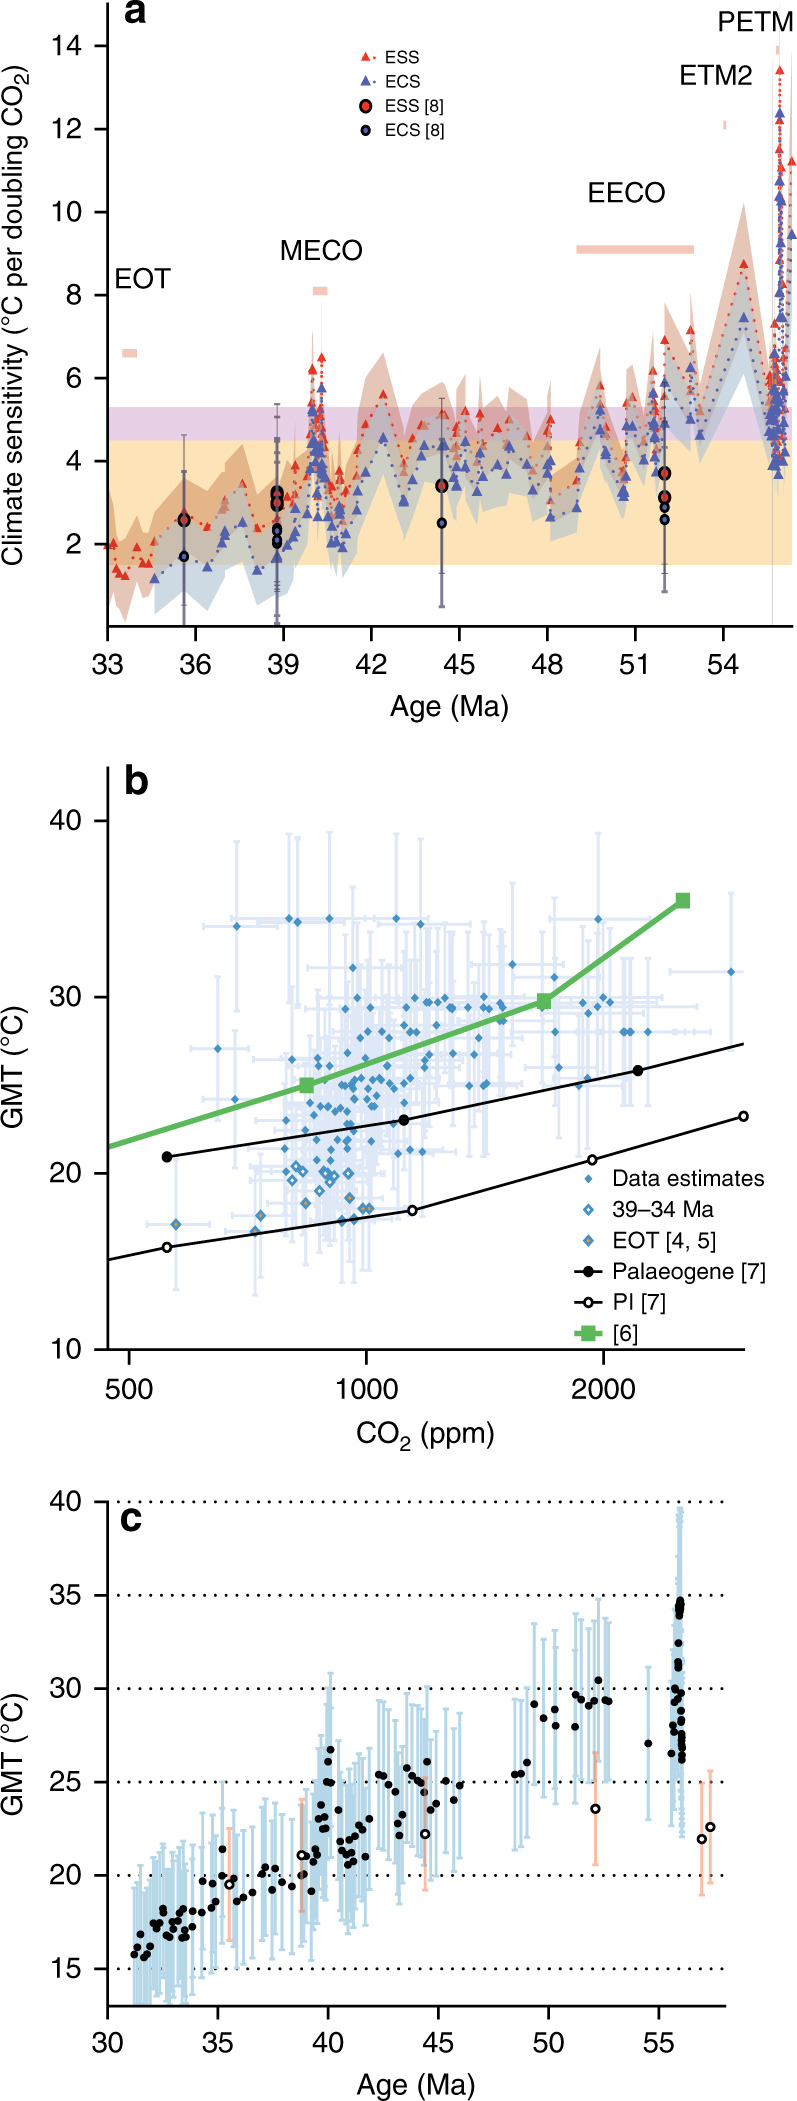
Fig. 5. Evolving climate sensitivity for the Eocene.

a Calculated ESS (red triangles and error envelope), and ECS (blue triangles and error envelope). See text for relevant methodology. Orange area represents the IPCC range in ECS95, and the pink highlighted area the updated 20th century ECS with the addition of state-of-the-art cloud physics96. Circles represent estimates from ref. 8. b Data-model inter-comparison, with all diamonds representing data. Open diamonds are the data between 39 and 34 Ma, and orange filled diamonds the EOT. Circles7 and squares6 are all model derived relationships (PI preindustrial). Uncertainties and error envelopes represent 1 s.d. of Monte Carlo propagated uncertainties. c Evolving GMT relationship for the Eocene. GMT is calculated using the BAYSPAR TEX86 record from ODP 959. Error bars represent the calibration and analytical uncertainty on TEX86. For comparison, the GMT estimates from ref. 8 are presented with open symbols and red error bars. NB the elevated ECS early in the PETM and ETM 2 are most likely a consequence of slight age model misalignments, or imply non-CO2 forcing early in these events.
