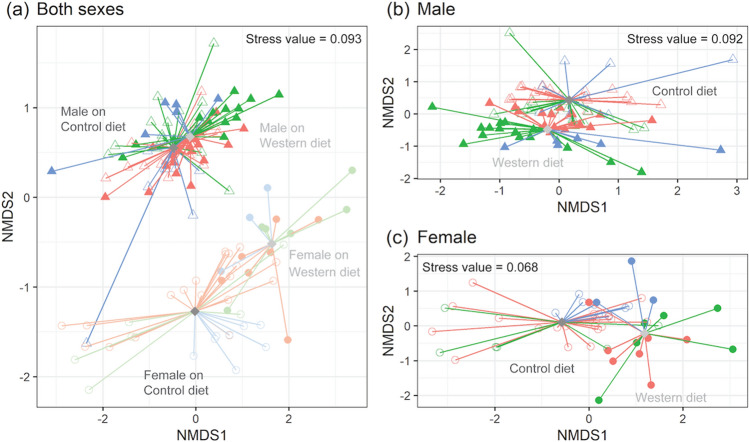
Figure 3.
NMDS plots of the urine metabolome. The centroid of each group is noted as a diamond. (a) NMDS plot generated with all samples included; (b) NMDS plot generated with only male samples; (c) NMDS plot generated with only female samples. Samples collected from mice at 5, 10, and 15 months are indicated in red, green and blue respectively; those collected from female and male mice are expressed with circles and triangles respectively; those collected from mice on the CD or WD are designated as open or closed markers respectively.

