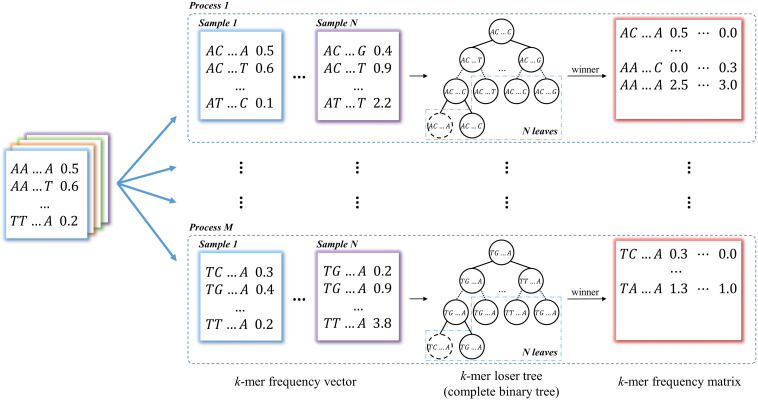
FIGURE 2.
The schematic diagram of producing k-mer frequency matrix. The k-mer frequency vectors are split into n processes (n from 1 to 256) based on k-mer prefix in lexicographic order. The loser tree is built and updated iteratively based on N sample frequency vectors in each process. The winners of loser tree are written to the k-mer frequency matrix.

